




8 min read
Calculated values without formulas
Learn how to calculate, summarize, and transform your data with the Calculation builder.

You'll learn how to:
- Create calculated columns without writing formulas.
- Summarize and transform data across your tables.
- Use structured column types to unlock smarter calculations.
How the Calculation builder works
Rather than writing formula syntax from scratch, the Calculation builder helps you create dynamic columns that automatically generate values based on the data in your table. The Calculation builder works by transforming information you already have into new information you want to display. For example, it can calculate days remaining from a date, pull profile photos from a People column, or count words in a Text column. To get started, add a new column to your table and choose Calculation builder from the column type menu.The Calculation builder walks you through two simple choices:
- Choose Calculate from to select the column you want to work with.
- Choose the Property to decide how you want that data displayed.

Take a look at the formula
At any time, you can click the f formula icon in the Calculation builder to view the underlying formula behind the calculation. It’s a great way to gradually learn how formulas work while still using the Calculation builder to make things happen quickly.
Build your first calculated column
A great first calculation to build is tracking how many days remain until a date. No more manually updating dates or doing the math yourself. Create a column that calculates the number of days remaining for every row in your table. For this example, start with a table that includes a Due date column.Create a days remaining calculation
- Add a new column to your table.
- Choose Calculation builder from the column type menu.
- Under Calculate from, select your Due date column.
- Under Property, choose Days from today.
- Rename the column to something clear, like Days remaining.
Add an overdue indicator
Instead of choosing Days from today in the Property field, choose Overdue, and you’ll get a checkbox column that updates automatically. Once you have an overdue column, you can take it further with automations. Set up a rule to send a Slack message or email notification any time a row gets marked overdue. See more ways to use automations.
Why can’t I edit this cell?
Calculated columns generate values automatically based on your data, so individual cells can’t be edited by hand. To change the result, update the source data, click the column settings and choose Convert to editable values.
Real problems you can solve with the Calculation builder
Here’s how it plays out across a few common workflows.Track status updates automatically
If you’re managing projects, bugs, or requests in a table, it’s often helpful to quickly see when each item was last updated. You might have a Status column tracking project progress and add another calculated column that automatically shows who last modified each row or when it was last updated. Row properties make this possible by referencing information about the row itself, not a specific column. They’re useful when you want calculations based on row activity or metadata, not just the values in your table.Here's what you can surface:
- When a row was created
- Who created the row
- When a row was last updated
- Who last modified a row
- A row’s unique Row ID
Teams can quickly see which work has recently been updated and who last touched it.
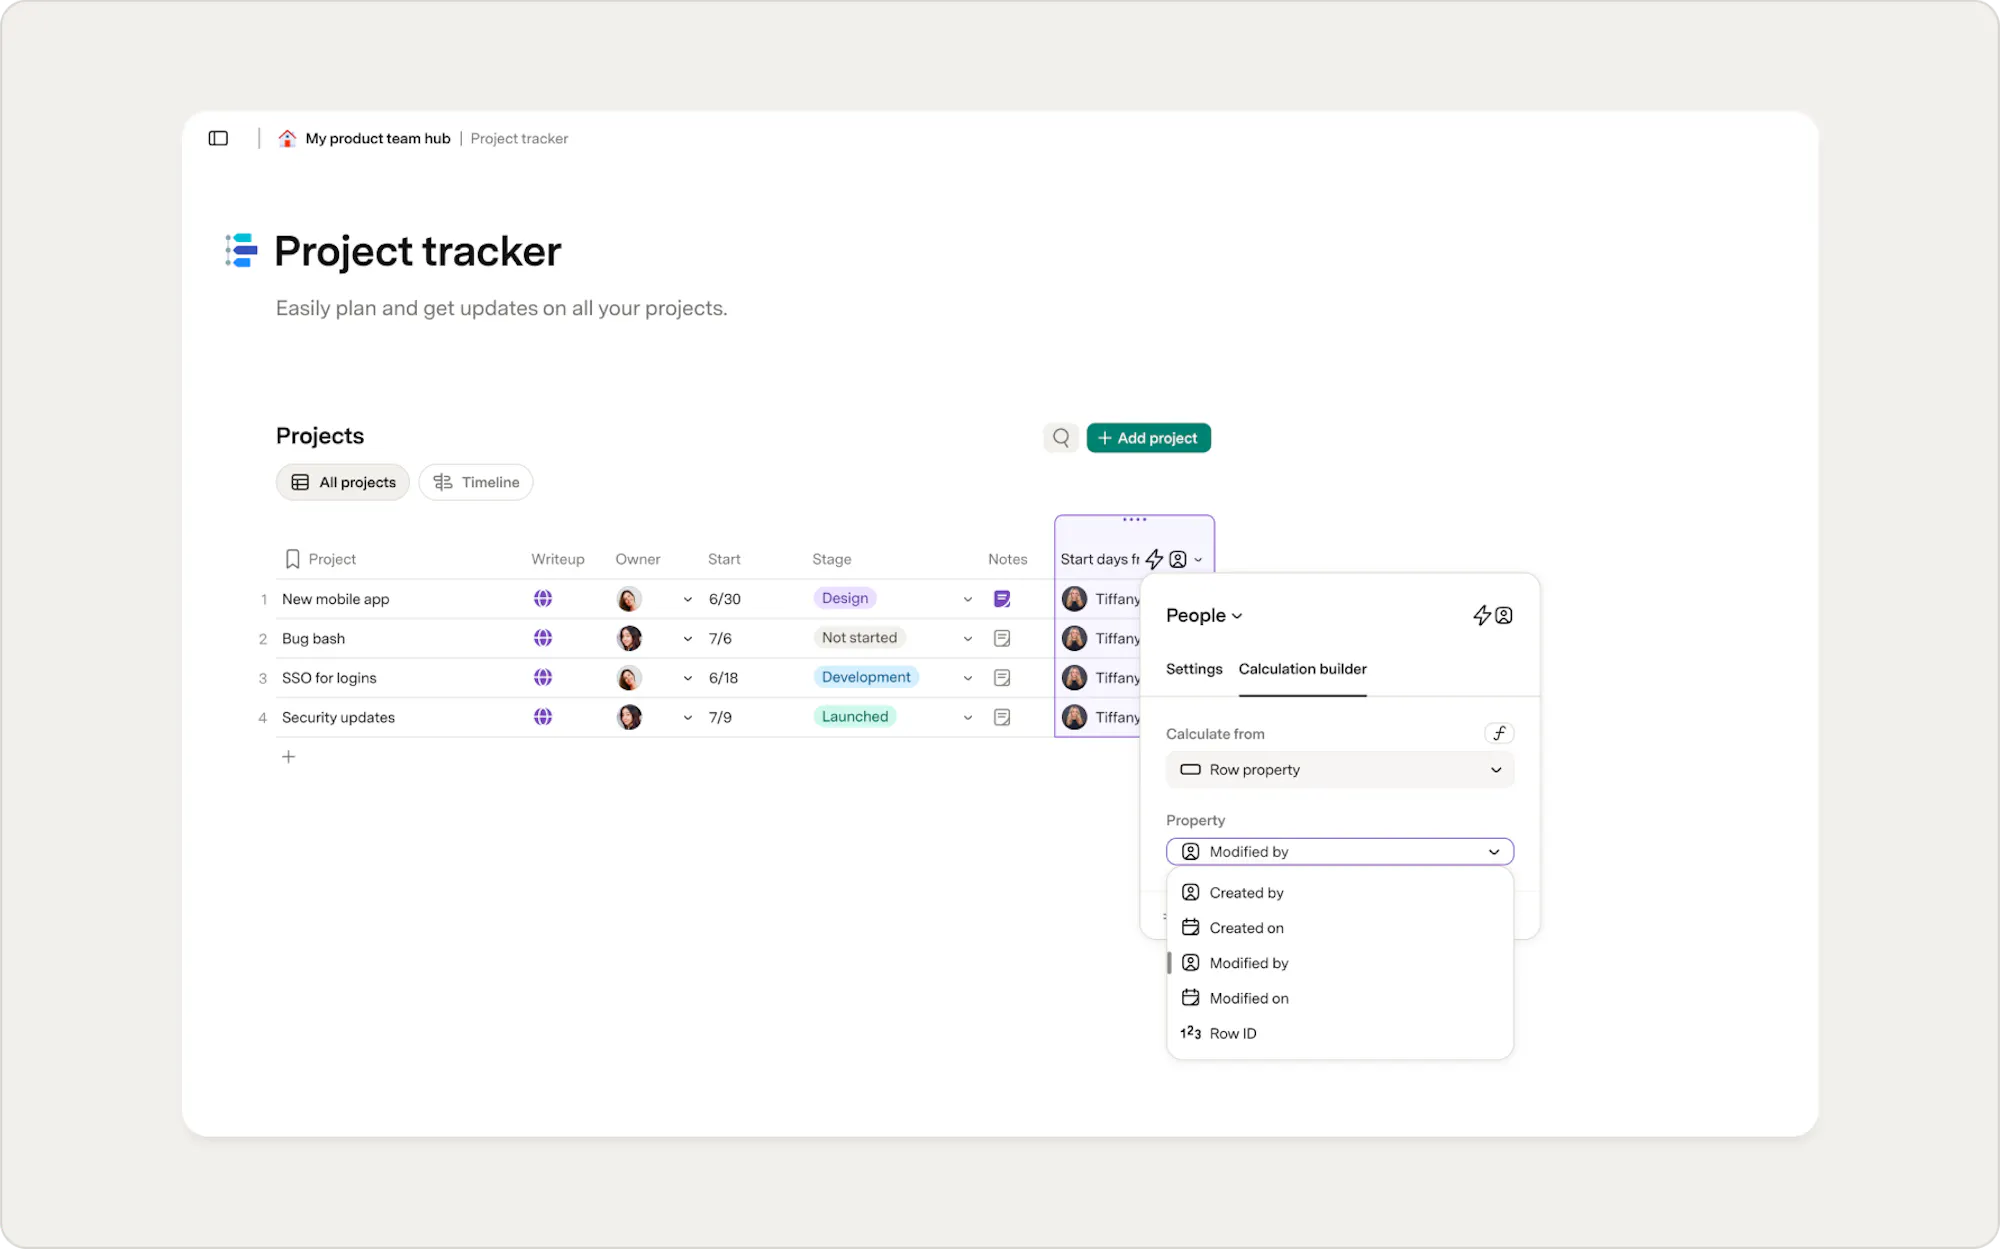
Clean up and analyze pasted text automatically
If your team creates or pastes social media drafts, campaign copy, or notes into tables, formatting can get inconsistent fast. Extra spaces, inconsistent capitalization, and manually checking content length are all small tasks that add up over time.The Calculation builder can help with that by:
- Removing extra spaces with Trim whitespace.
- Converting text to upper or lower case.
- Counting words or characters as content changes.
- Noting whether a draft has content by seeing if the column is blank.
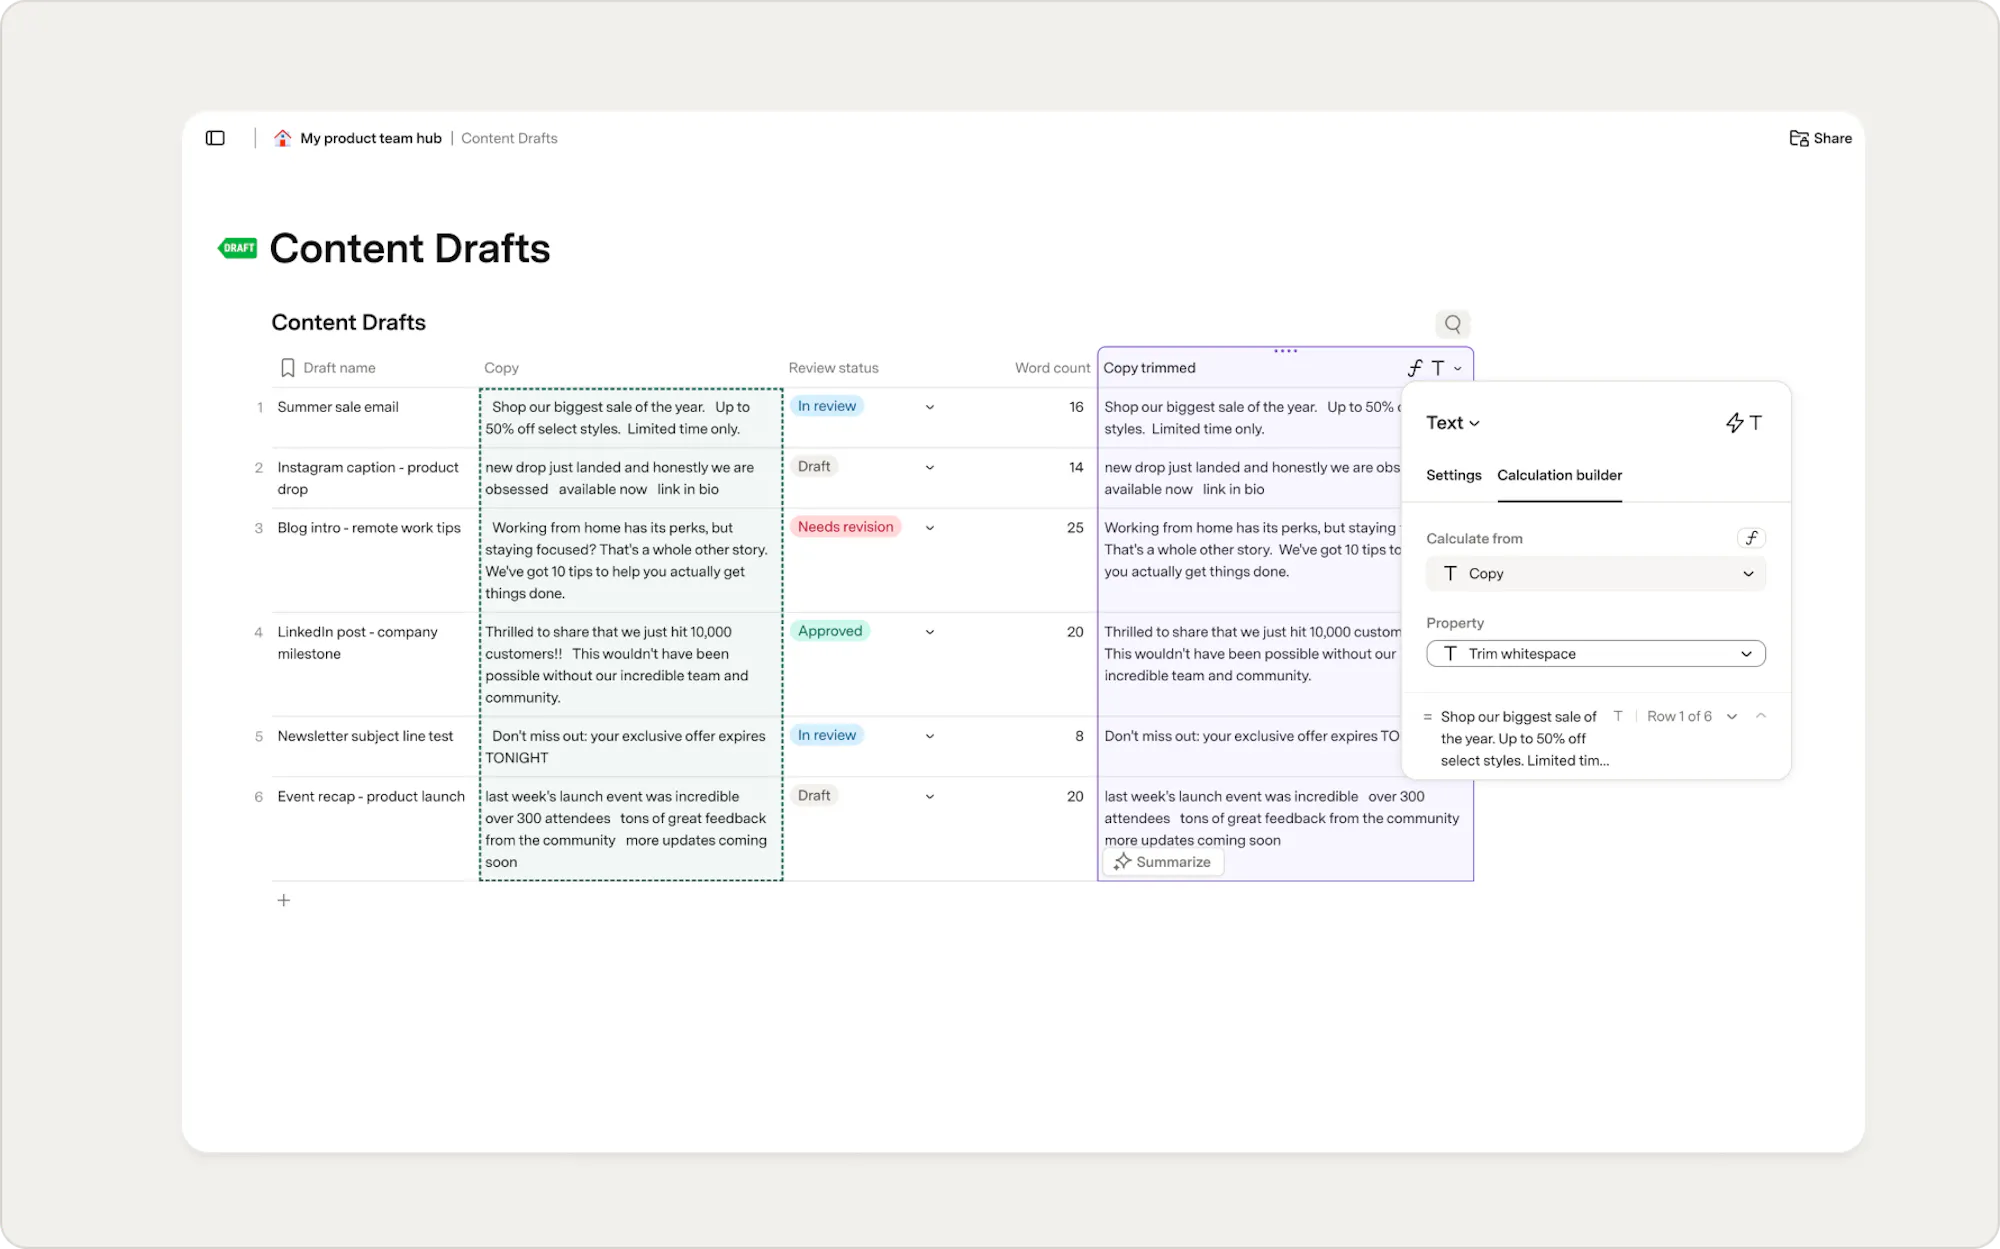
Keep teammate information connected
When teams track work in tables, people’s information is often duplicated manually across rows, documents, or workflows. Names get typed inconsistently, profile details go out of date, and teammates become harder to identify as projects grow. People columns solve this by storing connected teammate information rather than plain-text names. The Calculation builder can then pull useful details directly from those People columns. It's one reason why People columns are more powerful than plain text or select lists for tracking teammates.
You can display:
- Profile photos
- Names
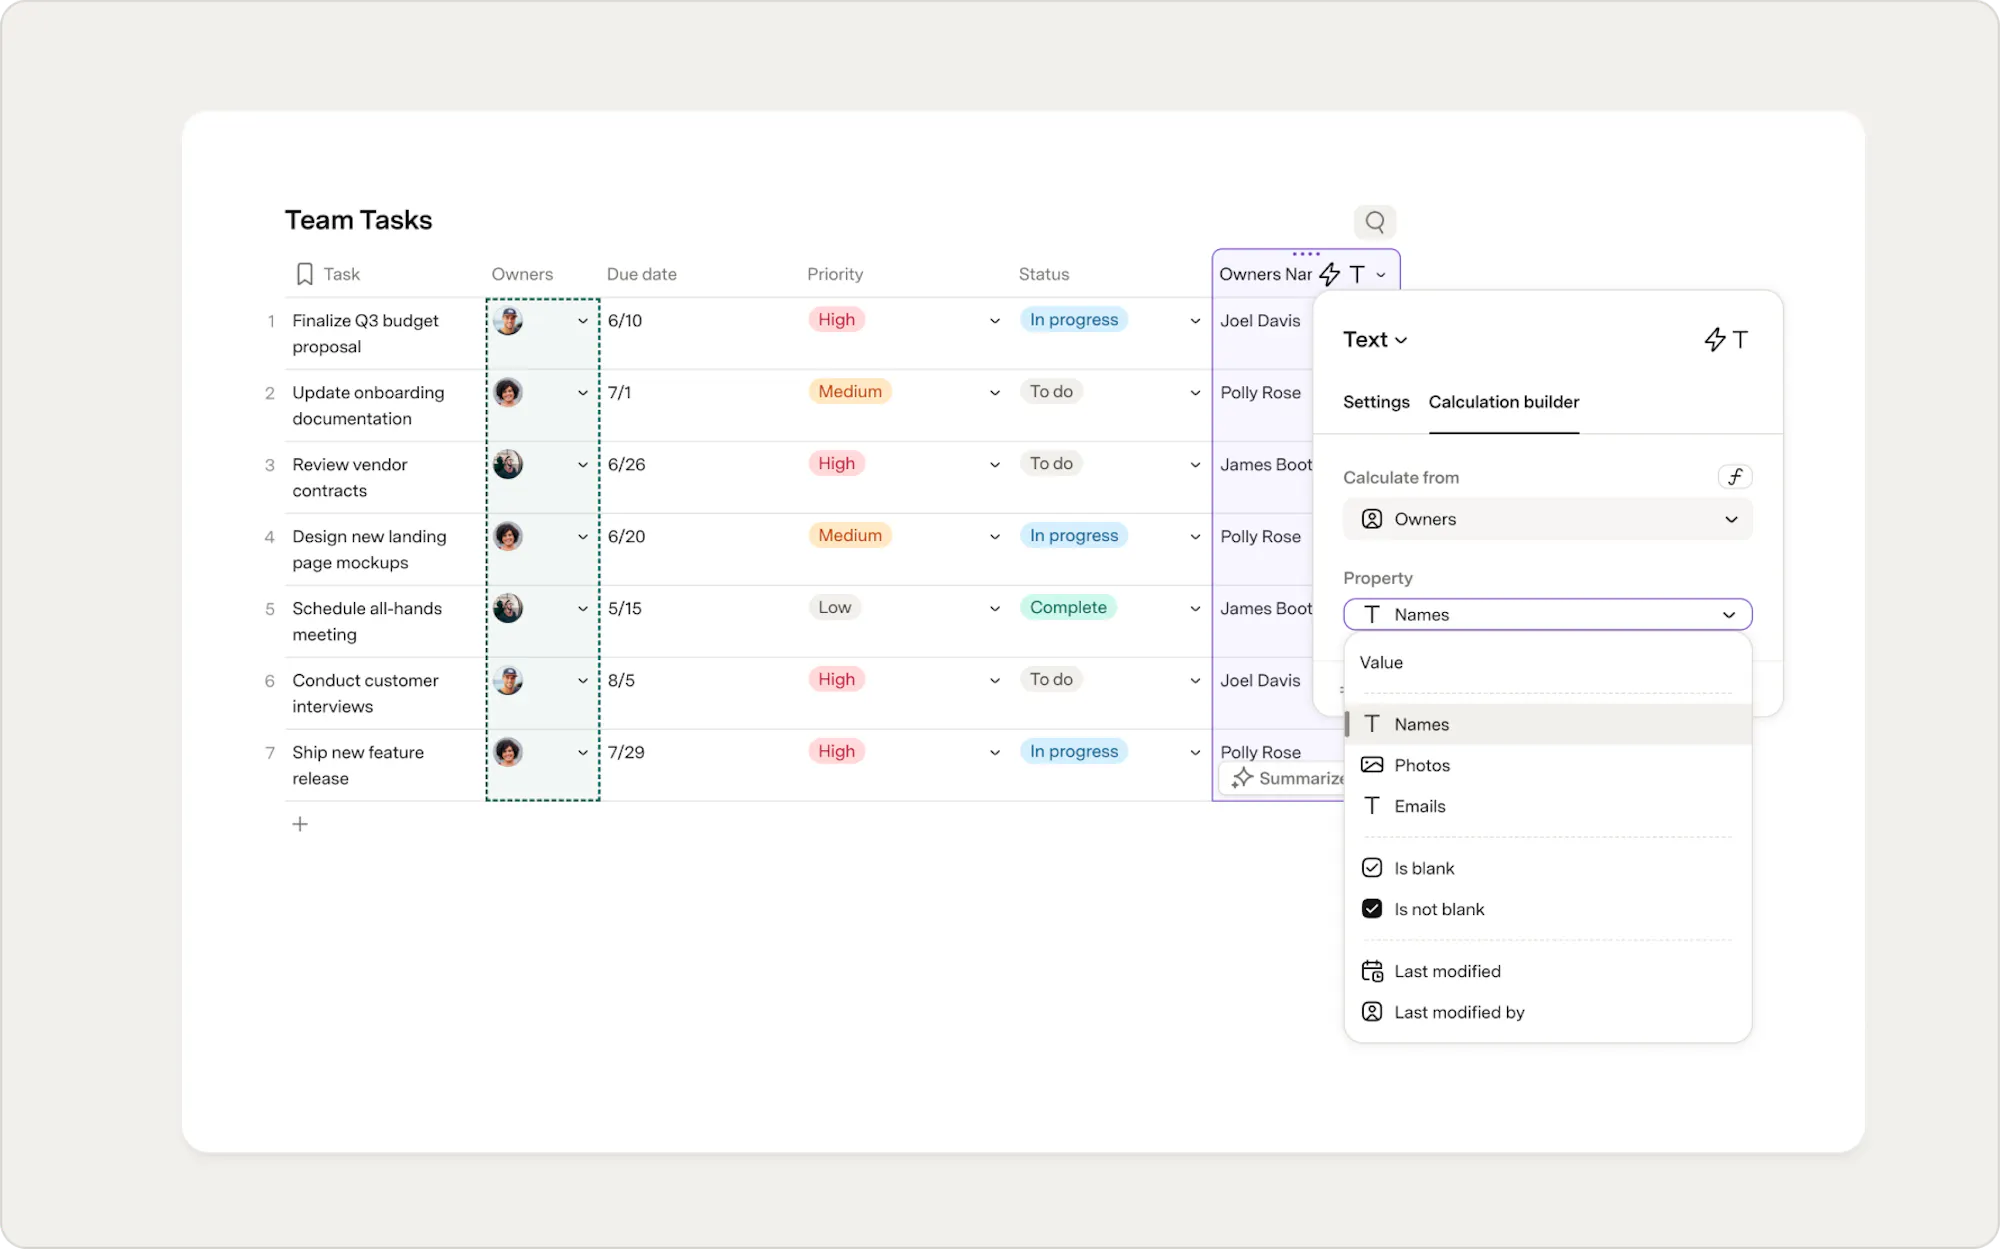
Turn reactions into lightweight approvals
Reaction columns can also work with the Calculation builder, making them useful for approvals, voting, and team feedback. For example, imagine your team is reviewing social posts, campaign ideas, or project requests directly inside a table. A quick calculation gives you that visibility across the whole table at once. No row-by-row checking needed.
With the Calculation builder, you can:
- Count reactions
- Show who reacted to a row
- Track participation across your table
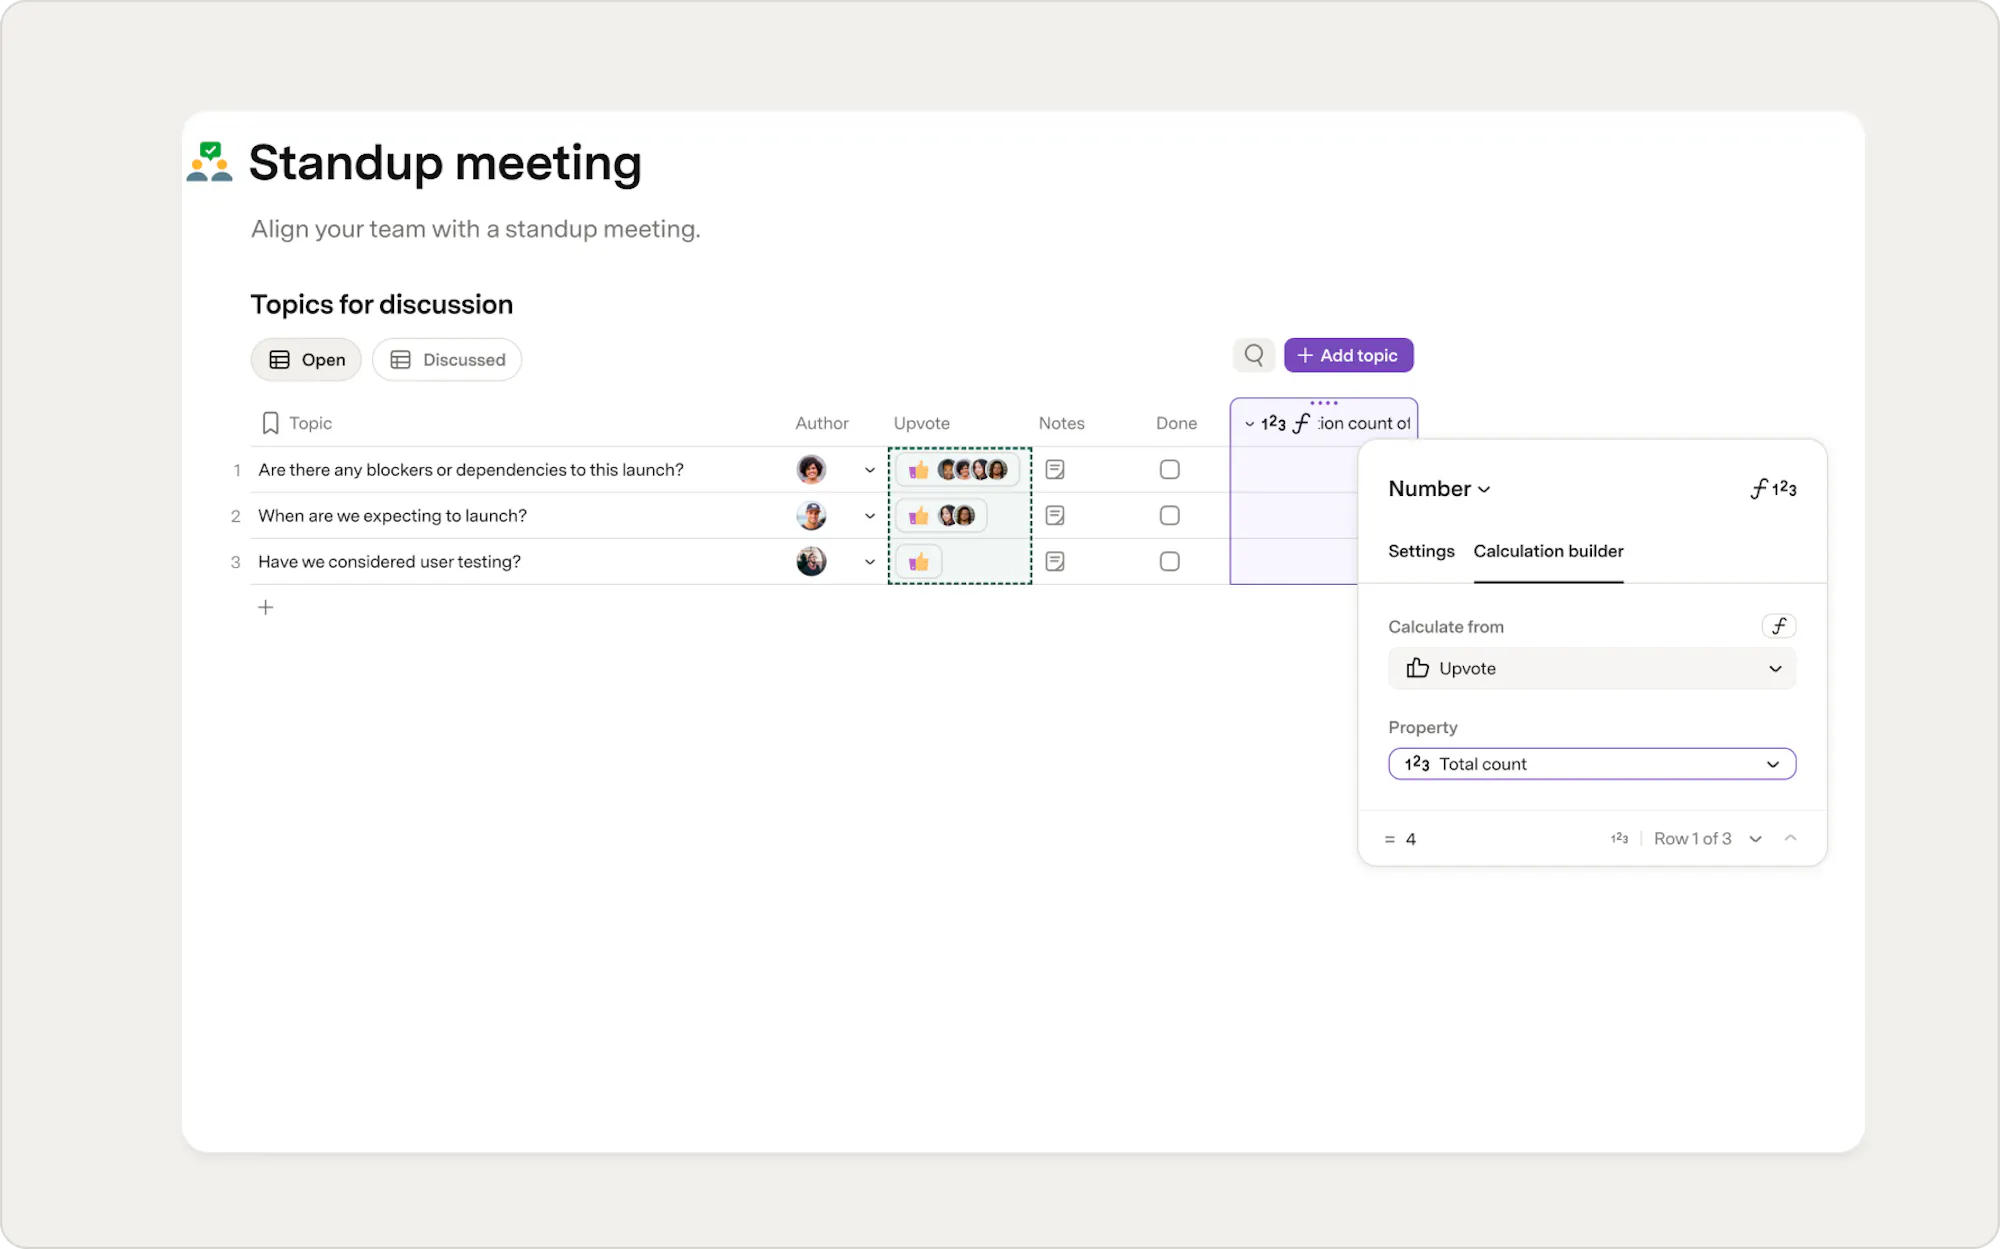
Get quick insights from your tables
The Calculation builder doesn’t just work inside columns. You can also use it to summarize information across an entire table:- Add quick calculations directly to the bottom of your table.
- Create metrics in dashboards, reports, or project overviews directly on the canvas.
Add quick summaries to a table
If you’ve used spreadsheets before, you’ve probably relied on quick totals and averages at the bottom of the spreadsheet. Superhuman Docs tables can do the same thing using summary rows. You can quickly count completed tasks, sum a budget column, or average survey scores.To add a summary row at the bottom of your table:
- Right-click a column header.
- Select Summarize.
- Choose the calculation you want to display, like Count, Sum, or Average.
- Select Show in summary row.
Surface table insights on the canvas
Your table has the data, but your doc needs to tell the story. Summarize table lets you pull live metrics out of your table and place them anywhere on your canvas or within your doc. You might display the total number of open tasks, the remaining budget, the number of approved requests, or the total campaign spend. Follow the same steps to add a summary, but choose to display it on the canvas instead of showing it in the summary row. You’ll now see the values from your table right on your canvas. You can adjust the size and styling, or right-click the value to edit the calculation or update filters.Can’t find the calculation you want?
That’s usually a sign it’s time to move from the Calculation builder to formulas. Formulas give you more flexibility for advanced calculations, custom logic, and workflows that go beyond the options available in the builder. The good news: you’re already using formula logic. The Calculation builder has just been helping guide you through it. At any point, you can click the f formula icon to see the underlying formula, make changes, or keep building there.
Now what?
You’ve now seen how the Calculation builder can help you calculate dates, summarize tables, clean up content, and automate repetitive work without writing formulas from scratch. As you continue building, you’ll start recognizing the formula patterns behind your calculations. And when you’re ready, you can always click the f formula icon to inspect or customize the underlying formula. Ready to go further? Check out our guide to Superhuman Docs' formulas.Was this helpful?
YesNo