How to score OKRs

The art of metricizing clear, measurable key results.

David Kossnick

Product Manager for Coda AI

At Coda, we use Objectives and Key Results (OKRs) to set goals and measure progress. It’s proved to be a good way to achieve our biggest goals. Teams plan quarterly sprints, set goals for the sprint, and evaluate success at the end. But, crafting clear, measurable key results can be tricky. At times it’s easy to ask: “Are we really measuring what matters?” We initially developed this guide and associated tables as a resource within the team at Coda. The goal of this is to show how we prioritize metrics based on their level of impact, and to increase clarity and focus for teams. We hope this might help you, too. In many cases, key results already have metrics, but they are not always consistently structured. At Coda, we track key results in a company-wide table so anyone on any team can understand what others are working on, and how they will know if they were successful. Each key result has a metric column to capture what that key result seeks to move and by how much. We maintain a Maslow’s Hierarchy of metrics: Impact > Outcome > Action. While we all strive to prove the impact of our work, sometimes it’s hard or impossible. Feature launches should have at least outcome metric (which means logging + dashboards present). Longer projects that span multiple sprints or quarters are sometimes hard to graduate to outcome or impact metrics before they launch, and tend to stick with action metrics. Here are some examples of real key result metrics we’ve had at Coda and how they could be reimagined as impact metrics, outcome metrics, action metrics, or without any metric.

Example KR metrics

Examples of real key result metrics we’ve had at Coda.

Clear, quantitative metrics leave no question about what success for the team looks like. Clarity creates alignment within the team and shows why they are working on something. Clear metrics help define what “winning” means and they deliver clarity for the rest of the organization on why the team is working on something. And they create an accountability loop for the team by asking: Are we headed in the right direction? The more we can answer that quantitatively, the easier it is to show that the work being done is helpful and meaningful. There’s also a hierarchy of clarity: specific outcome metrics > ambiguous impact metrics. Similarly, crystal clear action metrics > impractical outcome metrics that are just too hard or time-consuming to collect. Here are a few examples where a clear “weaker” metric is preferable to an ambiguous metric:

Clear metrics > ambiguous or impractical metrics

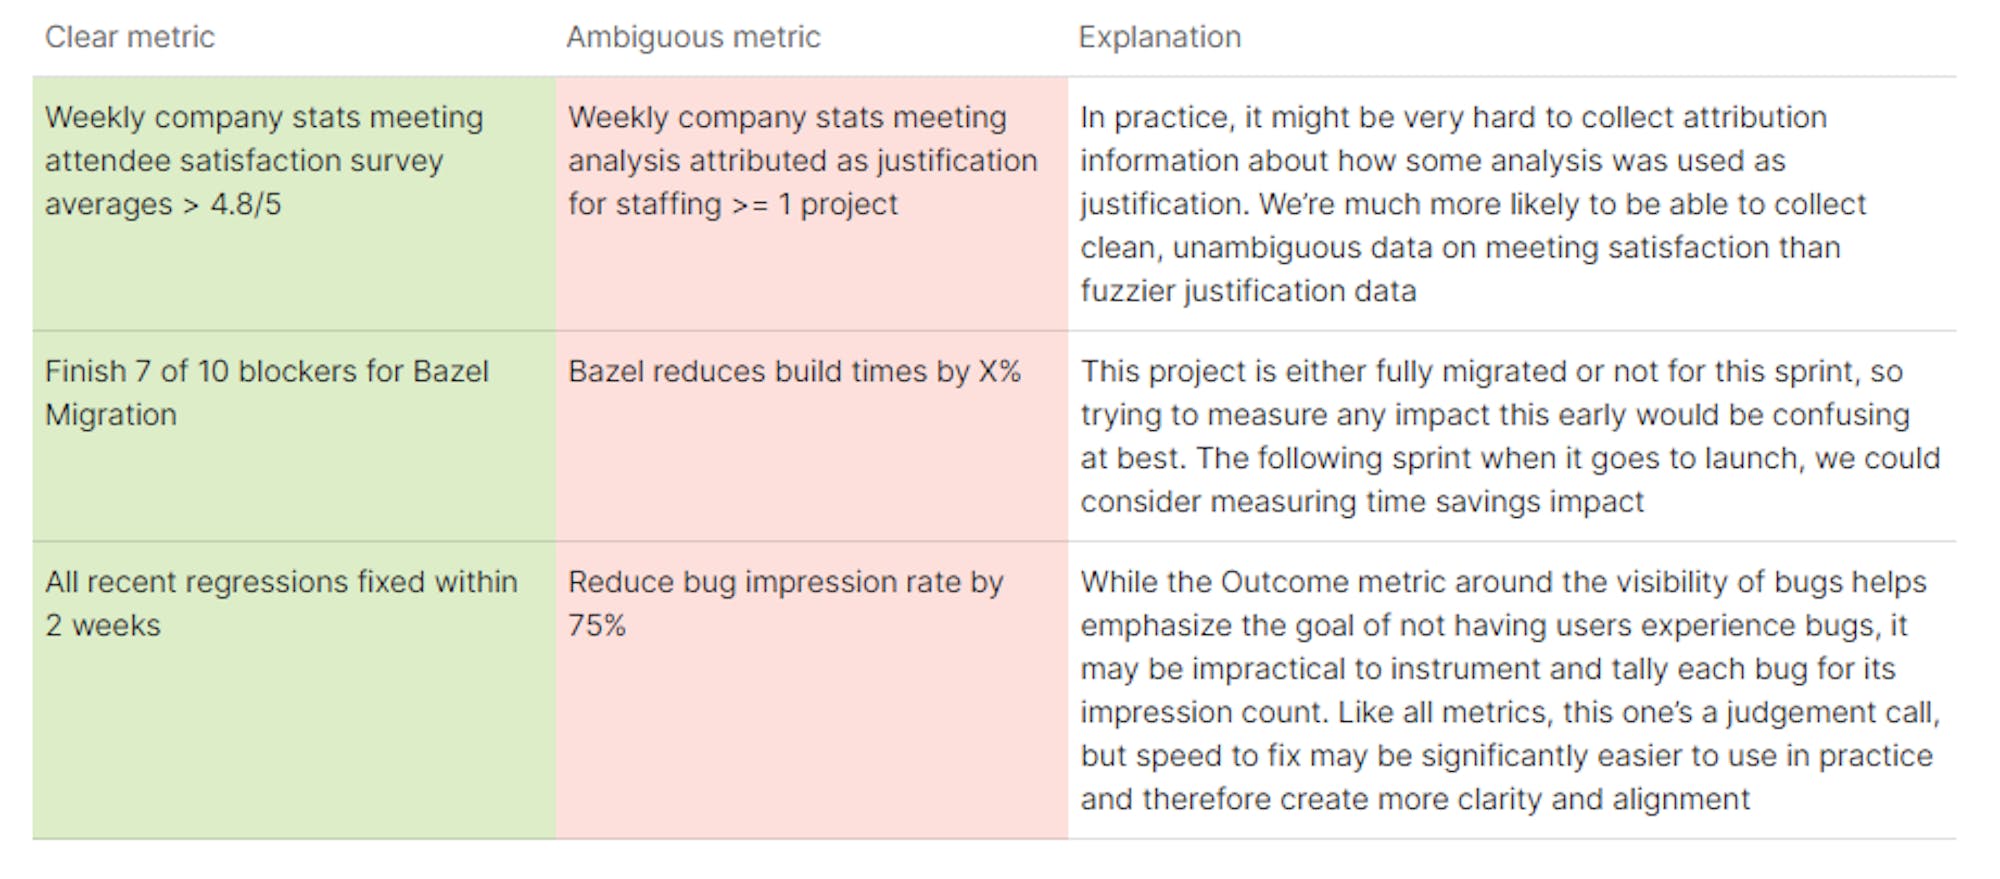
A few examples where a clear “weaker” metric is preferable to an ambiguous metric.

During planning cycles, the Coda data science and biz ops teams are available to help brainstorm metrics for key results. They hold jam sessions and office hours to chat more and refine phrasing. These informal get-togethers are a way to get perspective from other colleagues on how to frame problems and align our OKRs. Office hours are available throughout the quarter, but they’re especially helpful during the planning phase to make sure people understand objectives, clarity around metrics, or how to create dependencies. Metrics in key results have two main purposes: 1) Storytelling. OKRs are about creating meaningful and impactful change. People are attracted to stories because they see strong characters face adversity and save the day. A compelling key result and metric capture the motivation of a project for other teams. They also provide a window to look back and reflect. 2) Feedback loops. Metrics and key results are one way to hold ourselves accountable. There are two components of this: [A] Goal setting. It can be hard to predict impact, outcome, or action. But the better we can predict, the better we can prioritize (knowing the costs and ROIs for projects), and the better we can manage dependencies. Grading key results can be hard and sometimes emotional. We encourage teams not to get overly focused on the exact score (78% done or 79% done?), but instead focus on reminding teams of the motivations and sharing learnings. [B] Execution reflection. Did we knock it out of the park unexpectedly? What worked well and what didn’t? What was really challenging? Grading key results is a great moment to crystalize and share learnings with the full team. By implementing a metric that is simple to self-grade and create a dashboard anyone in the company can view to grade key results simply by looking at it. This removes subjectivity from the process and makes it more obvious whether the effort was successful. Hopefully you found this framework for choosing metrics for goals to be useful. To summarize -
  • Focus on having clear objective metrics over ambiguous impractical metrics.
  • Seek to measure impact, or if not, then outcomes, or if not, then actions.
  • Use your metrics to tell the story of your project and its aspirations, and to reflect on what worked or didn’t.
For more tips and recommendations, check out the Ultimate Coda Handbook for Planning & OKRs. Happy planning!

Related posts

Explore more stories about planning and OKRs.
6 key moments that have shaped OKRs

How teams do their best work, from Intel to Google.

What are SMART goals and how to set them

Best practices for identifying and writing your biggest goals.

How to integrate OKRs with agile epics

Integrate your objectives and key results (OKRs) with your epics (agile).