Skip to content
: responsible for strategic decisions on public health, budget setting & commissioning: responsible for ‘prescribing’ activities to meet personal need:responsible for providing activities to meet personal needs: responsible for deciding which activities to participate in: responsible for developing ‘tooling’ to support the above ecosystem roles
User research participants interviewed Activity providers interviewed 6 Application providers interviewed 11Frontline workers interviewed 9Managers interviewed 12Service Users interviewed 5Wider Research conducted 4


From the frontline worker perspective they want to be able to search for appropriate services, using language, conditions and segmentation and be able to report against terminology that means something to them. This set of language will be specific to each agency, like the police, the NHS, sport and leisure, local councils, housing etc. These frontline professionals cannot become experts in the different language of all sectorsFrom the provider perspective, they want to “tag” their services to these languages in a way that means they can be found when a search happens. Again, they don’t want to have to learn and then deliver 5, 6, 7 different mappings - one for each sector, where their service may have value into that sectorFor self-care searches, they want to use language that is not jargon and that means something to them and hence probably want a separate set of language that they can use for searches Finally, software providers need to know what their system should enable. 4 central taxonomies, agreed by all sectors, that make sense to activity (and service) providers. Activity (and services) should be mapped to the central taxonomies by activity (and service) providersSector led taxonomies e.g. Snomed can map their terms to the central taxonomiesThis allows a user to use a sector taxonomy to identify appropriate activity (or services)Alternatively a user can filter on the central taxonomies to identify appropriate activity (or services)Any change, therefore, to a sector taxonomy doesn’t impact on any other sector
 Research Steps
Research Summary
This final section outlines the steps taken in carrying out the user research. It is not necessarily in a sequential order as the research activity gave various insight relevant to each of the steps at various points throughout the project. Only a very short summary of each step is given but the details can be found under and in the Coda doc. Coda provides the reader with ‘hover over’ reference links and dynamic tables & graphs.
1 Stakeholders
The end to end process of a social prescriber referring physical activity was mapped out and the stakeholders identified as below:
@Managers
@Frontline workers
@Activity providers
@Service users
@Application Provider
Working with , we sought to interview at least 6 people within each stakeholder group as to what they believed were the barriers to social prescribing referring people into physical activity.
1.1 Stakeholders interview numbers
Stakeholder role
Activity providers
4
Frontline workers
12
Managers
13
OpenActive application providers
8
Other stakeholders
6
Organisation
Organisation
Organisation
Organisation
Organisation
Digilynx
Coventry Council
Hyndburn Leisure
Hyndburn Leisure
Blackburn Council
Blackburn Council
BPRCVS
Blackburn with Darwen Carers
BPRCVS
BPRCVS
NHS
BPRCVS
Social Prescribing Lead GP for North Southport PCN
BPRCVS
Enfield Voluntary Action
Enfield Voluntary Action
Active Partnerships
London Sport
BwD Refresh, BwD Council
Sport England
Active Lancashire
Blackburn Youth Zone
Rossendale Leisure Trust
Active Lancashire
Active Lancashire
HLSC
Blackburn Council
NHS England London Region
Pendle Leisure Trust
Schools Plus
Team Kinetic
Sported
Playwaze
TSG - Legend
PlayFinder
IMIN
Groop
NEL
NHS
NHS
Emduk
Swahsn
London Sport
2 Personas
From the interviews we developed generic personas to help form an understanding of the stakeholder context and issues. These personas are set out below.
2.1 User Research in Numbers
48
2.2 Personas summary 2
Persona
Avatar
Name
Role
Description
Page
Activity providers
Charlotte
Activity/Class facilitator
Charlotte is passionate about older people’s wellbeing and believes that appropriate exercise can have lots of benefits – falls prevention, mental health, loneliness prevention etc
Frontline workers
Lorraine
Social Prescriber
Lorraine works for a GP practice and aims to prevent people needing to see a GP when they may benefit more from social/physical activities than medicine/drugs. Lorraine will work with frequent GP practice visitors, rehabilitations, GP referrals (medicine can’t help) or when a patient is happy to have a chat to see if they may benefit from local social/physical activities.
Service users
David
Retired
David is a widower that is heading towards 80. He has always been fit but has not got out of the house as much lately and notices that things are a bit more of a struggle these days. His family are not too far away and do visit reasonably regularly but his friend died last year and he doesn’t have his dog anymore.
Service users
Tony
Unemployed
Tony is unemployed and has not worked since a mental health issue approx. 20 years ago. He is separated from his wife with whom he has two kids each of whom have given him a grandchild. DWP have allowed him not to search for jobs but every two years they stress him out with another interview to see if he could work again. He lives on his own paying rent (benefits) in the house he’s been in for over 30 years. He grow Bonsai trees.
Managers
Gareth
Health Partnerships & Commercial Manager
Gareth has a strategic responsibility for public health. He is keen to prevent people needing GP or A&E. He’d like to engage a significant number of people to become more active. He thinks social prescribing could help with this but recognises that there are a number of barriers to overcome.
Application Provider
Greg
Product Manager
Greg is a product manager for SPActive He is trying to provide a product to help frontline workers identify the best local services/activities that will help support their client list. They want to focus on their UI and features to enable the frontline workers to be more productive and help more people. They want a feed/API to access local service information that is rich and correct.
There are no rows in this table
2.3 User Journeys
The personas and interviews were developed into user journeys to highlight the barriers. Below is just the frontline worker rows and the full table is available under User Research.
Frontline worker user journey overview
1.Referral
1
2.Consider options
1
3.Shared decision
1
4.Attend
1
5.Participate
1
Frontline workers
5
Don’t see referral into exercise as their role
Difficult to know what activity sessions are available
Need to understand exactly what the activity/service is offering to ensure client can cope
Client isn’t interested in doing physical activity, too many other problems
Not enough local activity sessions can be found
Don’t trust information that exists
Client lacks confidence, has anxiety, embarrassed so needs hand-holding to attend
Need to know if the providers can cope with needs of the cohorts
Need to know if activity appropriate to client needs
Frontline workers lack confidence and skill set to motivate client to be active
3 Brainstorming & gap analysis
The barriers identified from the personas were consolidated into 14 key barriers. These were considered by the project team to brainstorm what might be possible to mitigate these. The team also carried out an initial tooling and standards review bearing the barriers in mind.
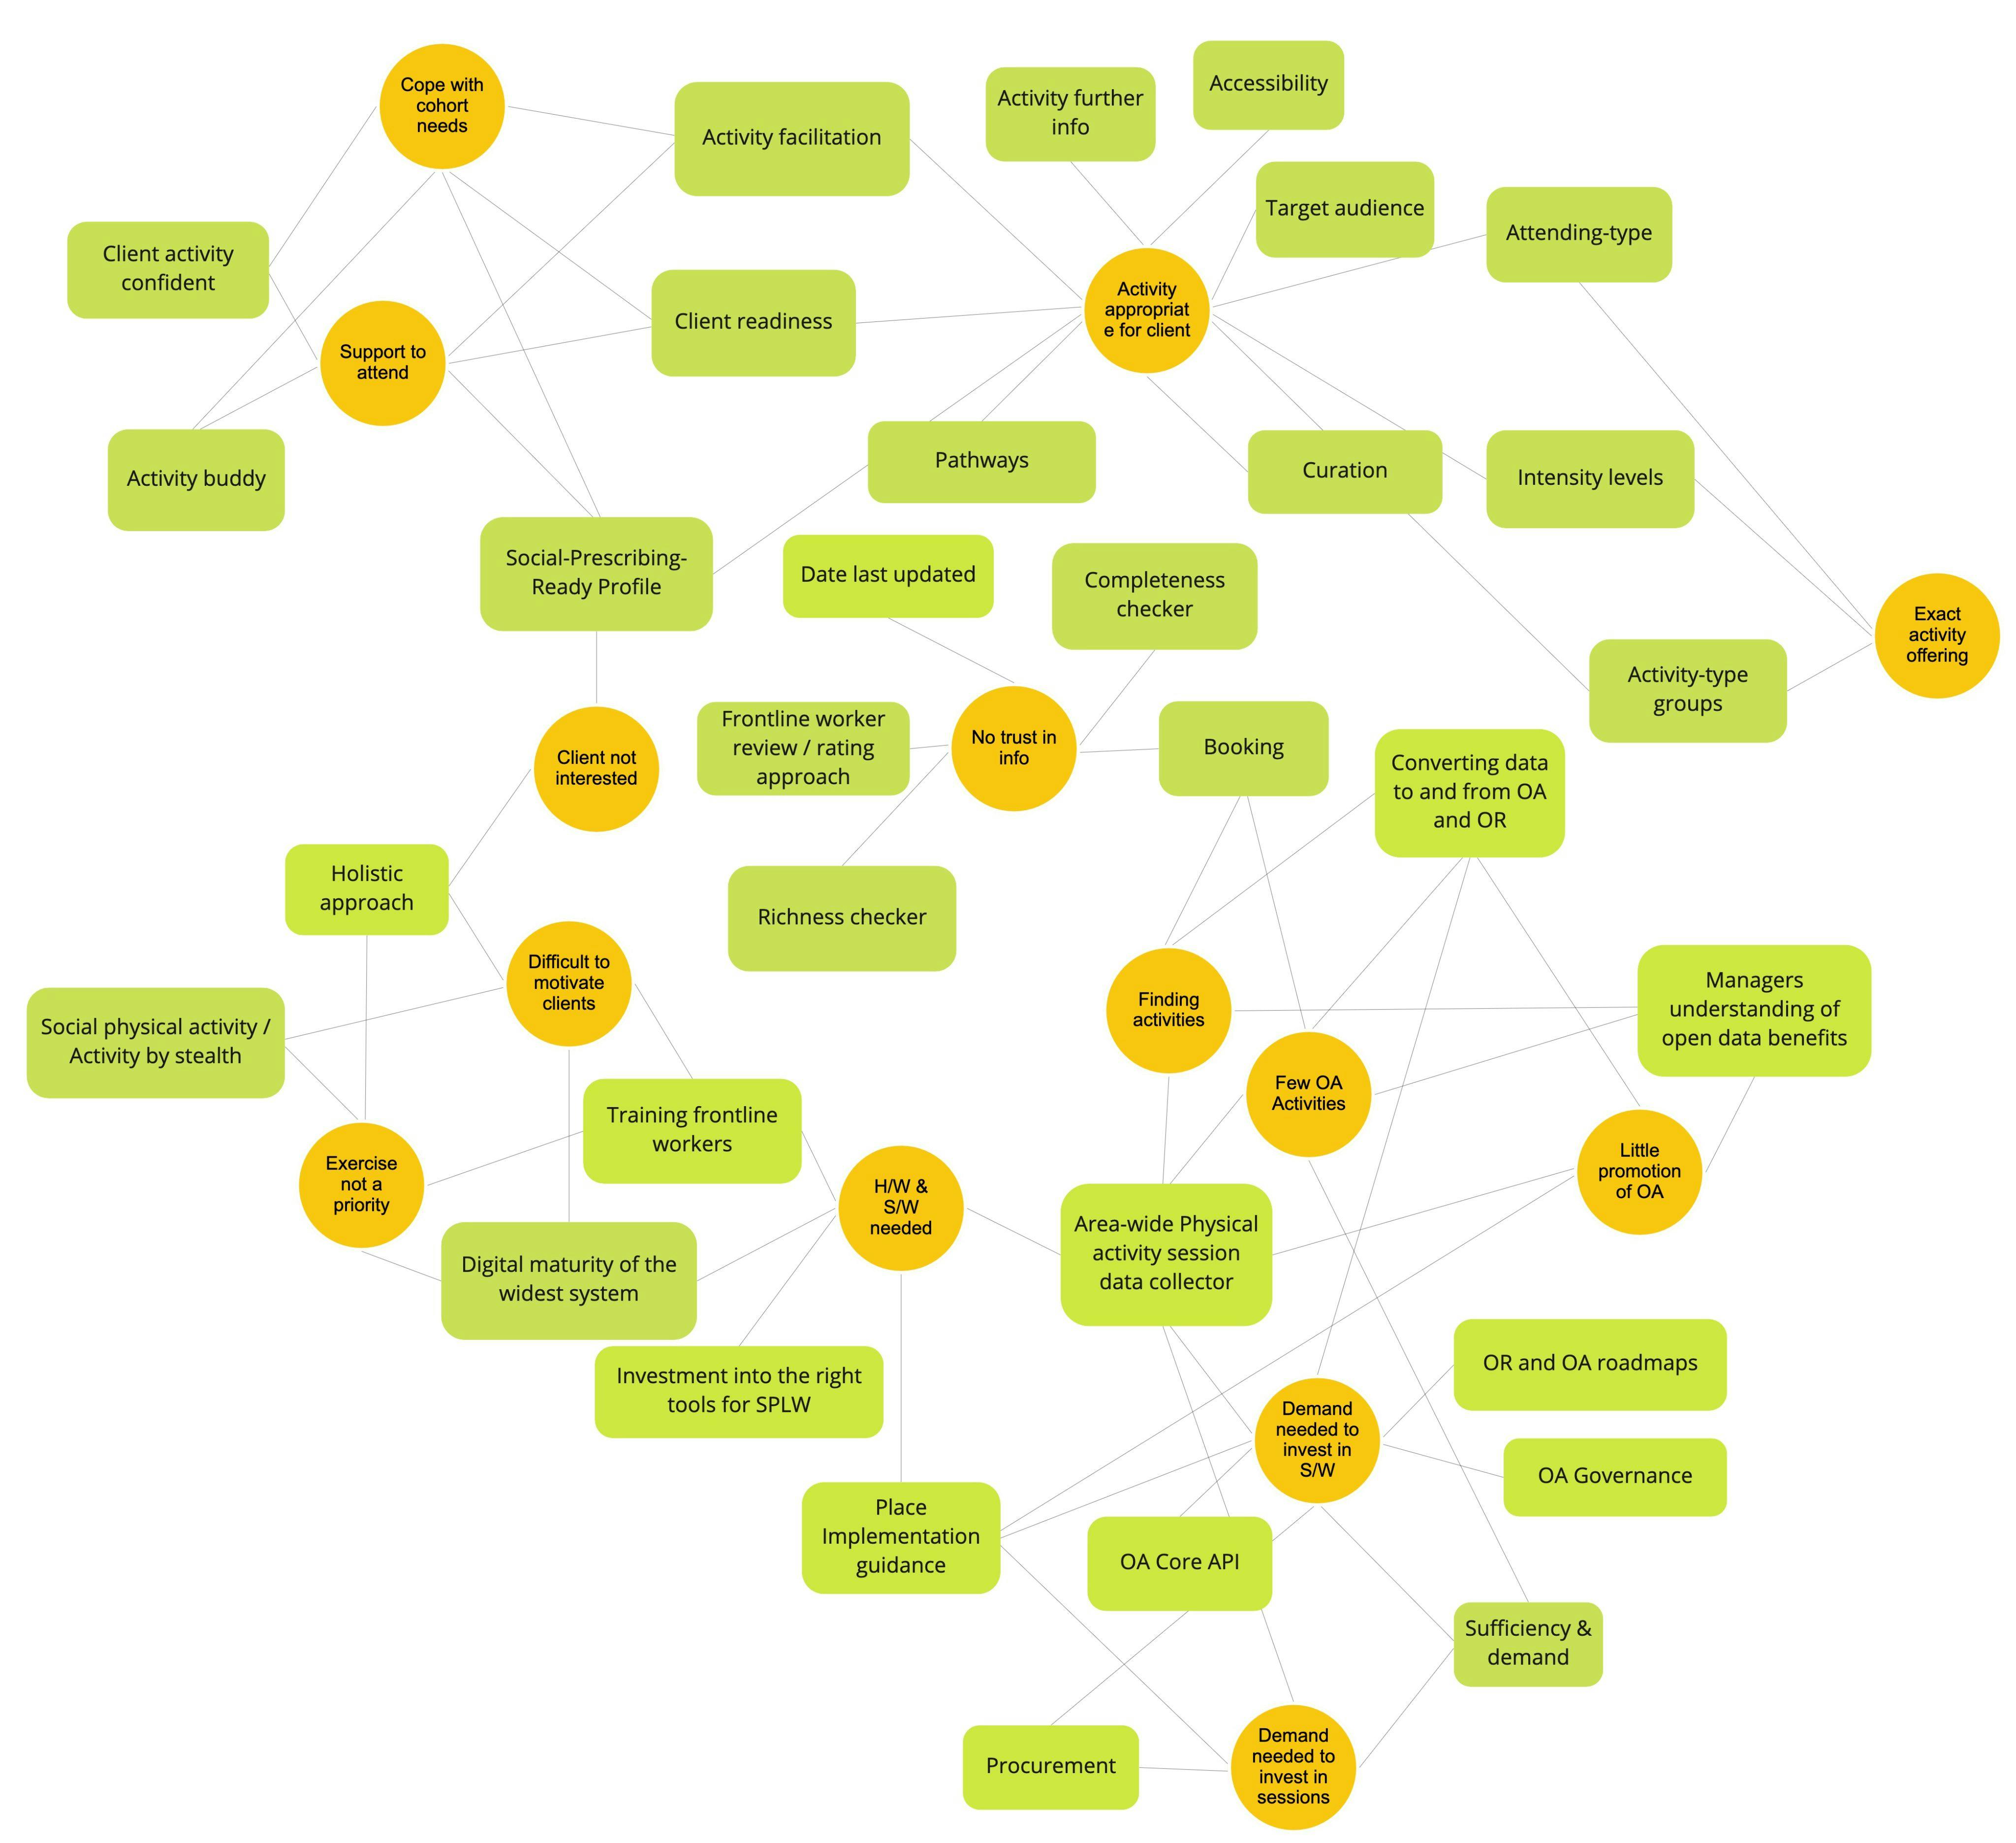
4 Workshops
Three online workshops used Miro in different ways to identify and prioritise ideas as to how to mitigate the barriers identified in the interviews. The diagram below is available inside the CODA doc to look at this in more detail, should that be of interest.
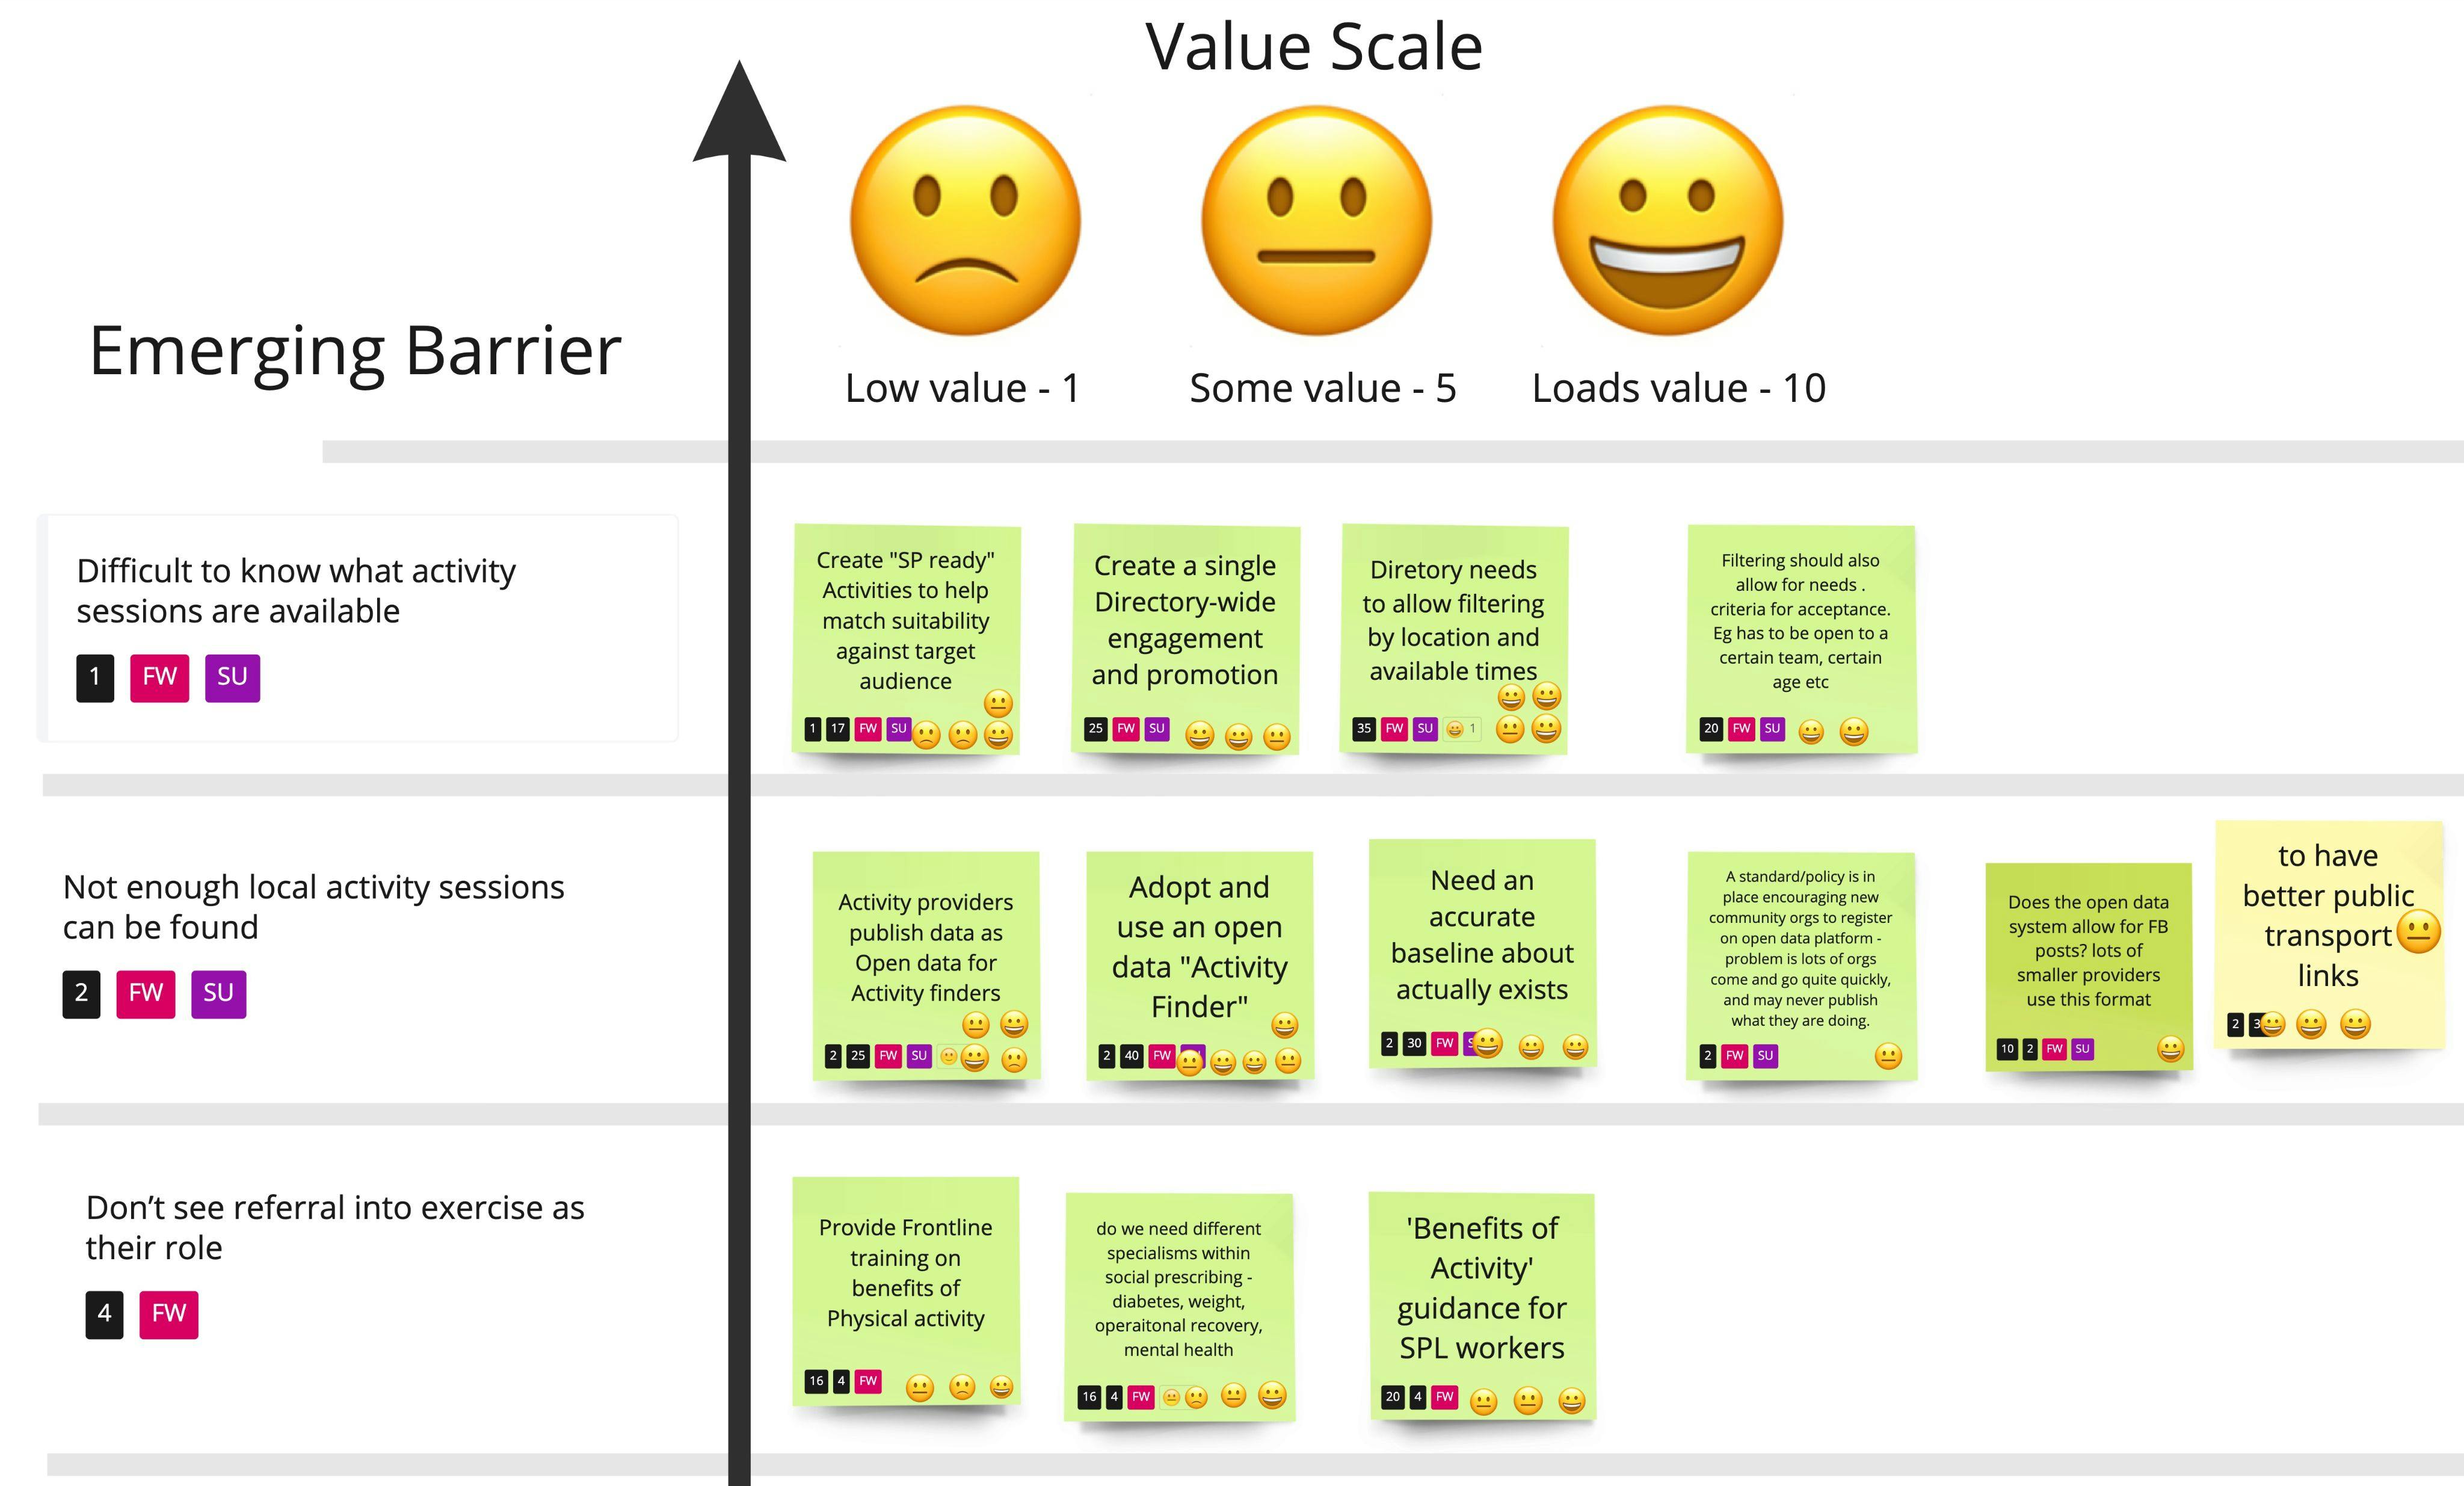
5 Questionnaire
All the ideas/approaches were added into Coda tables and linked together to barriers through stakeholder groups and benefits.
The barriers and outline strategies have been created into a questionnaire, an example of this is in the table below. As part of the real commitment to working !in the open”, the questionnaire remains as a live link at the link below and can be completed up until the end of May.
Example barriers feedback table.

6 Technical review of tooling and standards
The technical review was progressed in parallel to the user research. A workshop in the last week of the project gave the application providers a chance to feedback before the report was delivered to ODI. Feedback remains limited; the view of the researchers is that application providers will respond to the requests from commissioners / clients and are hence not too worried about what is requested. However some feedback has been provided by Elemental, Imin and DigiLynx.
The diagram below shows how OpenActive and OpenReferral could be transformed. The diagram is not intended to make a point here other than to show that a technical review of OpenActive has taken place.

7 Data Requirements & taxonomies
Taxonomies are critical, but this is not widely understood. The following provides this understanding
The conclusion is that a set of central cross-sector taxonomies are developed. This will allow sectors to map their taxonomies to this list, and then provide a single set of taxonomies for provides and self-care citizens to use. Without this work, which should be led cross-sector, one of the core principles of open data seems unlikely; namely a single repository that can be efficiently and accurately used cross-sector. The diagram below looks to offer this vision pictorially, demonstrating how existing taxonomy models such as needs and SNOMED can be mapped to recommended sets of central lists.

7.1 Potential Cross-sector Taxonomy Solution 2
Cross-sector Taxonomy Method
There are no rows in this table
8 Ecosystem
The following table describes the stakeholders that were interviewed and made up the ecosystem. The user journey shows the barriers that were identified for each of the stakeholders.
8.1 Organisations by Stakeholder 2
Activity providers
4
Frontline workers
12
Managers
13
OpenActive application providers
8
Other stakeholders
6
Social prescribing application provider
3
Kevin Flinton
Digilynx
Hayley Noel
Coventry Council
Lisa Charnley
Hyndburn Leisure
Linda Horsfields
Hyndburn Leisure
Michelle Rutherford
Blackburn Council
Tracy True
Blackburn Council
Alison Jones
BPRCVS
Isma Sajid
Blackburn with Darwen Carers
Shaun Dodds
BPRCVS
Amy Whitham
BPRCVS
Robbie Fraser
NHS
Tony Armstrong
BPRCVS
Dr Simon Tobin
Social Prescribing Lead GP for North Southport PCN
Deborah Dewhurst
BPRCVS
Helen Price
Enfield Voluntary Action
Jessica Bunn
Enfield Voluntary Action
Tracey Lines
Active Partnerships
Oliver Sisman
London Sport
Richard Brown
BwD Refresh, BwD Council
Tina Pilkington
Sport England
Mark Stephenson
Active Lancashire
Leon Crosby
Blackburn Youth Zone
Ken Masser
Rossendale Leisure Trust
Ben Fatimilehin
Active Lancashire
Paul Blythin
Active Lancashire
Linda Vernon
HLSC
Sarah Quinn
Blackburn Council
Joe Fraser
NHS England London Region
Chris Rigby
Pendle Leisure Trust
Andy Halliwell
Schools Plus
Chris Martin
Team Kinetic
Helen Clayton
Sported
Charlie Clark
Playwaze
James Barter
TSG - Legend
Jamie Foale
PlayFinder
Nish Desai
IMIN
Barrie Taylor
Groop
Devika Vadher
NEL
James Watson
NHS
Martin Cattermole
NHS
Jade Cation
Emduk
Denys Rayner
Swahsn
Chris Norfield
London Sport
Alice John
4 Global
Leeann Monk-Ozgul
Elemental
Mo Rahman
Social RX
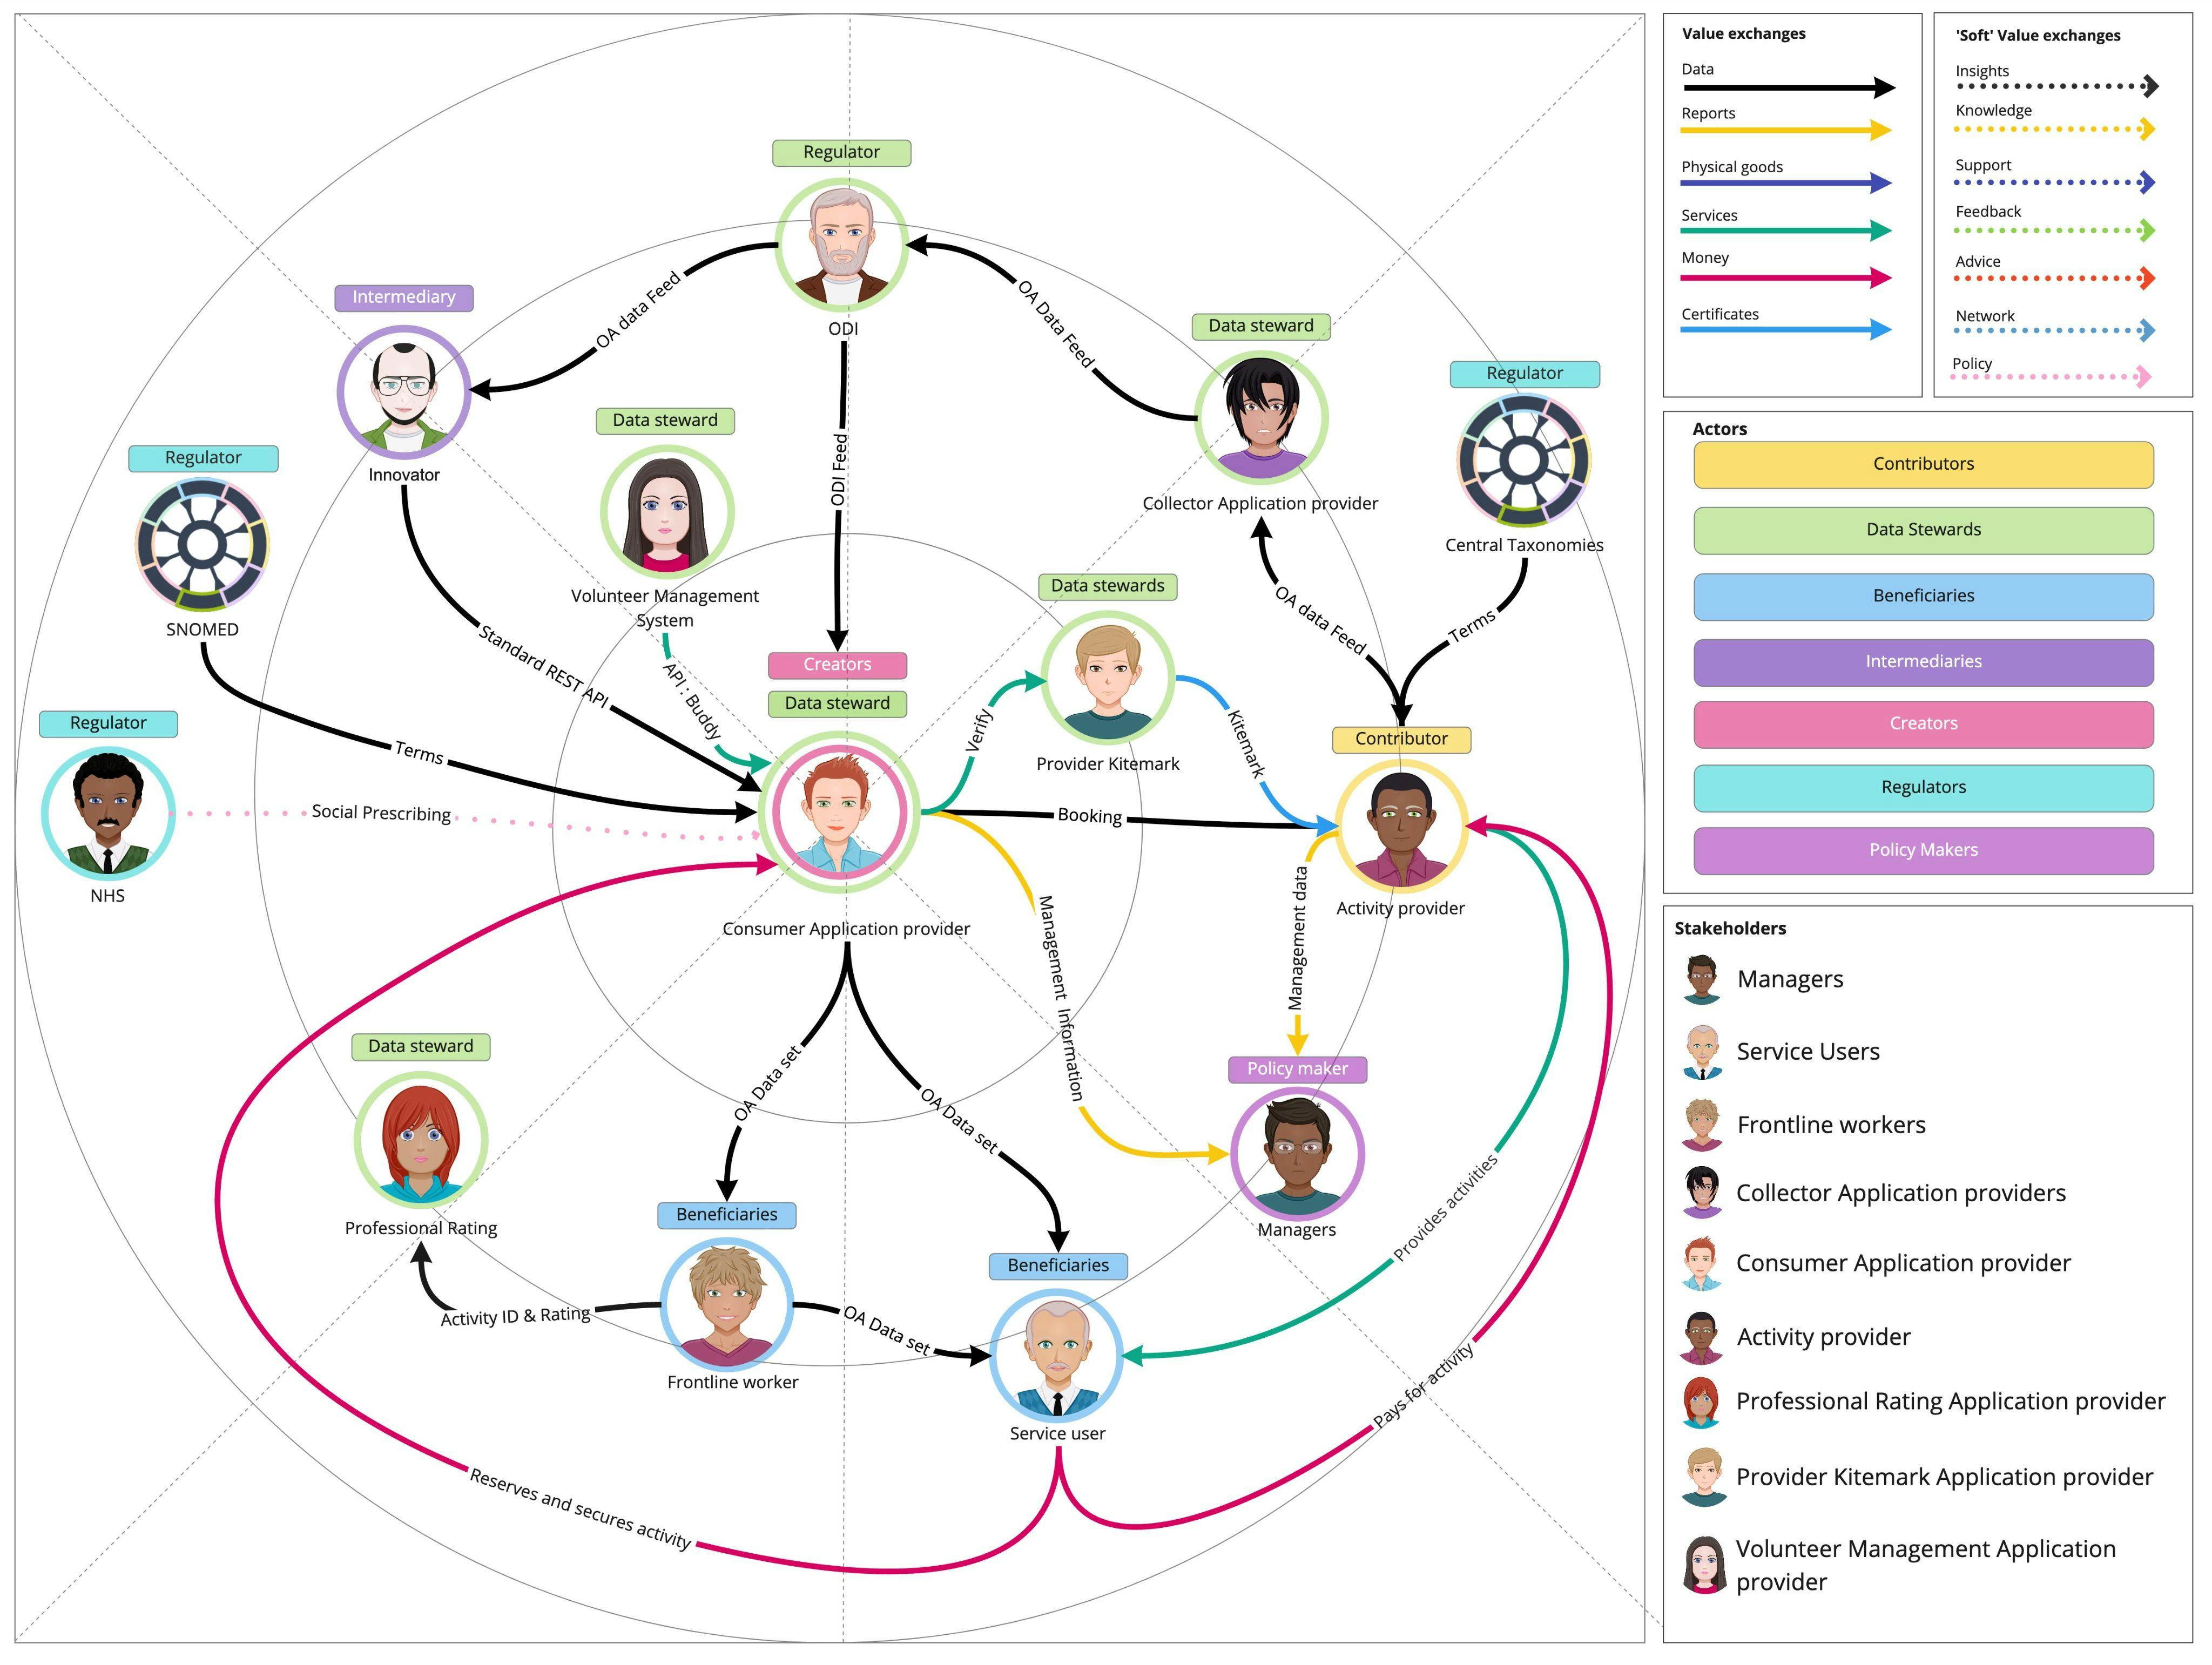
8.2 Data-flow
The data-flow diagram was drafted using the based on initial research of the end to end process. The key stakeholders were identified and added into the diagram. This was then reviewed for potential improvements as the project progressed. More details can be found on the page.
@ODI Mapping Tool
9 Coda
Coda has been used as a convenient way to collect and share findings from ongoing research into the barriers of using data within social prescribing initiatives. It will remain available as a resource until at least June 2021.
You can access this site as if it were a but if you register for a free Coda user and login then you will be able to add comments.
Want to print your doc?
This is not the way.
This is not the way.

Try clicking the ··· in the right corner or using a keyboard shortcut (
CtrlP
) instead.