Logging
Logs are the primary way to debug and troubleshoot your connectors once they are running. Depending on what you're building and where it runs, there are a few different kinds of logs available.
Viewing any of these logs requires Pack admin or Can test privileges on the underlying Pack. The entries you can see are scoped to a container.
- Go - The container is the chat session, so you'll only see entries from your own sessions.
- Docs - The container is the document, so you'll see entries from activity in a document you have access to, even if someone else triggered it.
Log entries are kept for approximately two weeks, after which they are no longer available.
Connector logs
Connector logs show the execution of the individual building blocks in a connector, for example when a formula is calculated, a button is pressed, or a sync table syncs. Each entry can include details from network requests and any messages you output with console.log().
The connector logs contain information about each time a formula in the connector was used in a tool call, either by an agent or by Go directly. To view them:
- Open the connector's settings screen
- Click the Session logs button.
The logs are grouped by the Go session where the connector was used, with the most recent session at the top. To get the latest results, click the refresh button in the upper right of the logs panel.
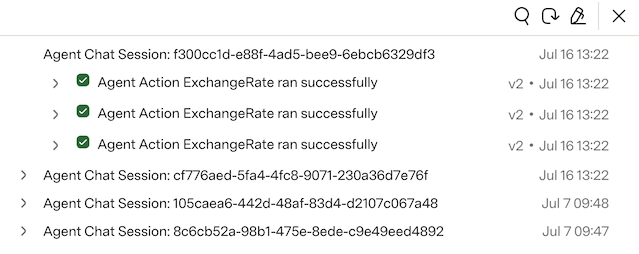
The connector logs contain information about each time a building block was run in a doc. This includes the formula engine executing a formula, a user triggering an action, or a sync table refreshing. To view them, open the doc with the connector installed and then use one of the options below:
- Open the Pack maker tools panel
- Open the Pack side panel and click the View logs button
- Hover over the broken connector formula and click the View error details link
The logs are grouped by invocation, with the latest entries at the top. New log entries are displayed automatically, usually a few seconds after the connector is run — there's no need to refresh the page or reopen the panel.
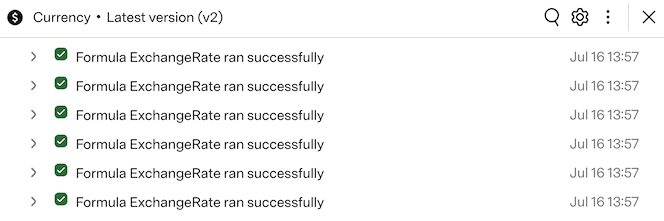
The panel will only show the logs from one connector at a time. To change the selected connector you can click the connector name at the top of the panel and select a new one from the dropdown.
Ingestion logs
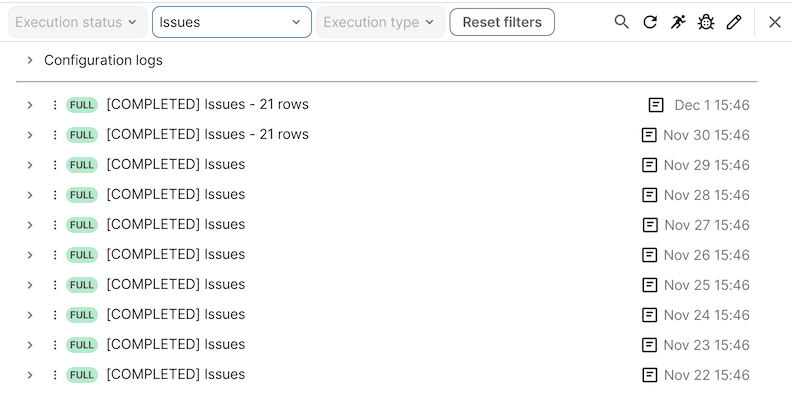
Connectors that use Indexing and include sync tables will generate additional logs for the data ingestion jobs that run periodically.
To access the ingestion logs:
- Open the connector's settings screen
- Click the Connector logs button.
Select a table from the Datasource dropdown to see the logs for that sync table. You can see the recent syncs for the table, and drill down into individual executions of the sync table and any associated logs.
Adding log messages
You can add your own messages to the connector logs from your code using the standard JavaScript method console.log().
let response = context.fetcher.fetch({
  method: "GET",
  url: "https://api.example.com/items",
});
let items = response.body.items;
console.log("Retrieved %s items.", items.length);
This is useful for debugging both during development and in production. The Packs runtime only includes a subset of the full console methods, specifically:
console.debug()console.error()console.info()console.log()console.trace()console.warn()
When running your connector locally with the CLI these messages are printed to the terminal instead. See the CLI guide for more on local logging and debugging.
Reading the logs
However you open them, connector logs share a common structure. This section explains how entries are organized and how to drill into the details of an individual run.
Invocations
Every time your connector is run it generates an invocation, which groups together all of the other logs that come from the connector while it was executing.
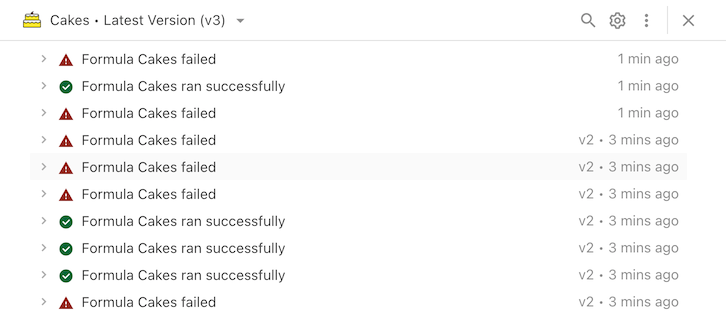
Each invocation has a brief description, if it was successful or failed, approximately when it was run, and what version of the connector was run (if not the latest).
A new invocation is logged each time your connector is run, for example when a formula is calculated or a button is pressed. When a sync table syncs you'll see an invocation for the initial sync, and an additional invocation for each continuation of the sync.
Duplicate invocations
When looking at the logs in Docs, you may see duplicate invocations for the same formula. Some common reasons for this include:
- Using the formula editor, which runs formulas multiple times as you type to generate a preview of the result.
- Multiple users have the doc open at the same time (each browser will run the formula).
- The backend running a recalculation as a part of normal operation.
Entries
Clicking on an invocation expands it to reveal individual log entries.
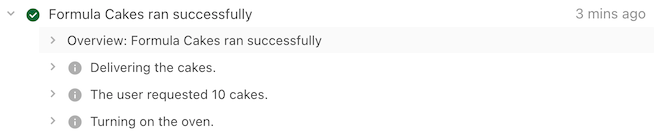
The first entry will always be an Overview of the invocation. Additional entries are shown in reverse chronological order (latest entries at the top), and are added when your connector makes a fetcher request or logs a message. If your connector encounters an error the execution will stop and no further log entries will be added.
Details
Clicking on a log entry expands it to reveal additional details.
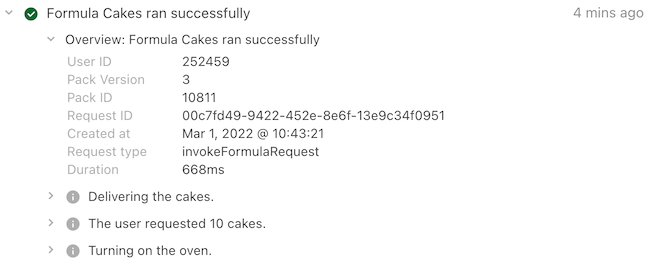
These details include information you can use directly (Version, etc), as well as internal details that may be useful when working with support (Request ID, etc). The Overview log entry will include a Duration field containing the total execution time.
Failed invocations will include some additional detail in the Overview entry.
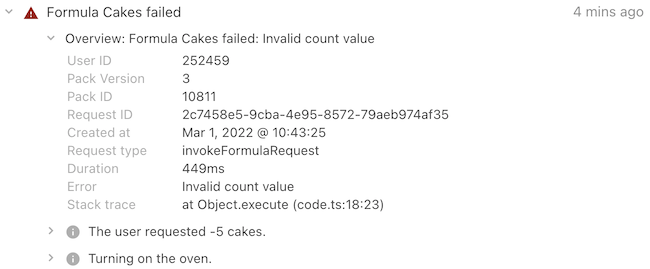
Specifically the Error field will include the error message, and the Stack trace field will include the line number where the error happened (code.ts:18:23 means line 18, character 23).
HTTP requests
Log entries for fetcher requests include an extra link at the bottom called Show HTTP request details. Clicking this link will open a dialog that shows the full details of the request, including the headers and bodies of the request and response.
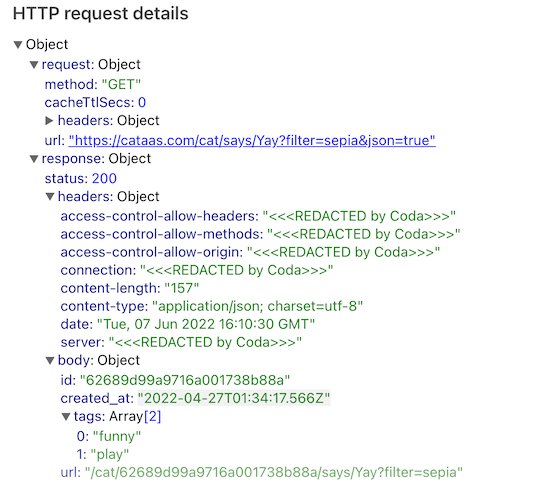
Just like in your connector's code, some headers are redacted as well as any user credentials.
Searching
You can search for logs using the magnifying glass icon at the top of the panel.

Search results are no longer grouped by invocation, but instead a flat list of entries from across all invocations. You can expand an entry and click the View related logs link to view all of the log entries from that invocation.