Skip to content
currencysales territory
Skapa en Datakub
We will create a cube based on the fact table FactResellerSales:
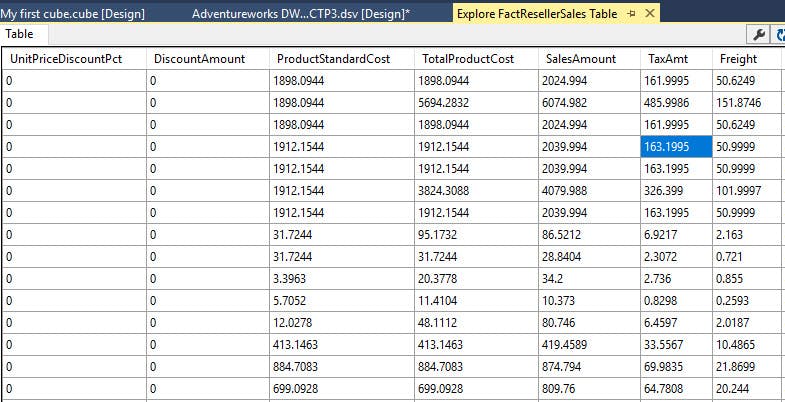
FactResellerSales shows information about resellers’ sales like discount amounts, tax amounts, freight, sales amount and other related information.
We will create reports about the fact information combined with 2 dimensions:
The Currency dimension, will help us to detect amounts in different currencies around the world and Sales territory will help to detect sales, discounts, etc. per region.
In order to start get started in SQL Server Data Tools aka SSDT, open a new project and select Analysis Services Multidimensional and Data Mining models:

In the Solution Explorer, right-click Data Sources and select New Data Source:

You will receive a Welcome wizard, press next:

Select the option to create a new Data Source based on existing or new connection and press the new button:

In the Provider, select a Native OLEDB\SQL Server Native Client 11.0. For Server name, select the SQL Server with the AdventureworksDW database:

Select the data connection, just created, and press next:

In Impersonation information specify a user with access to the AdventureworksDW database:

In the Completing the wizard, press finish:

We created the credentials to connect to the AdventureworksDW database. We will create now the views. In this process, we will select the tables to be included in the cube.
In solution explorer, select New Data Source View:

Select the data source just created:

Select the table FactResellerSales:

Include the dimensions DimSalesTerritory and DimCurrency. These dimensions include information about sales regions and currencies:

Once the wizard is completed, press finish:

As you can see, the fact table and the dimensions have a relationship. If the common columns are equal, the relationships are detected automatically:

To create a cube, we will add dimensions to the cube.
In the Solution Explorer, right click and select New Dimension:

You can create a dimension based on templates, time tables or based on existing tables. Select the option Use an existing table:

Select DimCurrency as the main table. By default, the key column is currency key:

In available attributes, select currency name:

In the Completing the Wizard step, press finish:

Now, you will have a dimension created like this one.
Drag and drop the Currency Name from the attributes pane to Hierarchy:

Once that you have the first dimension created, Currency name, we will create the sales territory dimension. In solution explorer, right click Dimensions and select New dimension:

Select the option use an existing table:

Select the table dimsalesterritory:

Select the attributes that you want to be browsable in the reports:

Once that the wizard is completed, press finish:

In the new dimension created, click the process icon to process the dimension. The process will generate the structure and load data to the dimension from the SQL Server table:

Press run to process the dimension:

In the Process Progress, close the process once that the process is succeed:

You can refresh the dimension to view the dimension just processed:

Process the Dim currency dimension also:

Once processed, you can verify in the Browser tab:

We will now create the cube. In the Solution Explorer, right click Cubes and select New Cube:

In Select Measure Groups Tables select FactResellerSales table. Measure group tables are used to include the table with data to measure. A measure can be the number of sales, amount sold, freight, etc.:

Select the data to measure. We will uncheck the keys and check the other attributes to measure:

Select the dimensions that you want to add to the cube:

You can also add the fact table as a dimension (degenerate dimension). In this example, we will not add it:

Once that the cube is created, press finish:

You will have the cube created with the fact table (in yellow) and the dimensions (in blue). Press the process icon to process the cube:

In Process Cube, press run to process the cube:

Once processed, go to the browser:

Press the refresh icon:

Drag and drop some measures from the Measure Group to the design pane:

Now drag and drop the currency name to the graph pane, you will be able to see the measures grouped by currency:

Drag and drop the Sales Territory Country. You will now be able to see the measures grouped by currency and territory:

___
Mer info:
Installera och sätt upp SSAS.
Installera och sätt upp Visual Studio 2019.
Ladda ner ett dataset med minst 1 fact + 2 dimensioner för att skapa en kub, som tex denna:
Gör en “restore” på denna bak-fil till din vanliga SQL-server i SSMS (alltså inte mot SSAS ännu).
Restore databas från Bak-fil
Sätt upp kub i VS2019
_____
Want to print your doc?
This is not the way.
This is not the way.

Try clicking the ··· in the right corner or using a keyboard shortcut (
CtrlP
) instead.