Skip to content
Though your Red Flag Metrics will be distinct, you can nevertheless identify the behaviors that signal when users are about to cancel or unsubscribe. Leverage what you learn to intervene with high-risk users and lower your churn rate.Unless you do some digging, you won’t know when your customers are struggling. Look for behaviors that signal when customers are having trouble and think of ways you can help them along.Don’t limit your testing to flight risk customers. Think of ways you can improve the UX and reward your loyal customers as well.
How Groove Reduced Churn by 71% By Defining “Why” Customers Quit

Despite a steady stream of new users, SaaS startup 4.5% churn rate meant the company’s growth was unsustainable.
When they met to discuss and attempt to address the issue in January 2013, they realized they had little insight into exactly why customers were leaving. They decided to systematically in order to determine what correlated with church.
The Research
Groove uncovered distinct differences between the users who abandoned and the users who stayed. They refer to these differences as “Red Flag” Metrics (or RFMs). RFMs allowed Groove to identify which users were at risk before churning actually happened.
For the first 30 days of the customer life cycle, Groove’s most significant RFMs included length of first session and frequency of logins. Total number of logins also proved to be an important metric, though not as much so as the former two. Groove found that users who stuck around after the first 30 days had initial sessions that lasted, on average, three minutes and 18 seconds.
By contrast, first sessions of users who quit lasted only 35 seconds on average. While users who remained customers logged in 4.4 times a day on average, those who did not only logged in 0.3 times per day on average. These metrics are indicated in the chart below:

Groove uncovered another significant, though less immediately apparent, metric—time spent on a certain task.
For example, creating a rule in the Groove app tends to take between 10 and 30 seconds, while customizing a support widget is a 2 to 3 minute task. Yet many users who churned had taken significantly longer to accomplish tasks such as these.
Finally, Groove wanted to identify and leverage their “power users,” so they created a segment of customers who not only hadn’t quit after 30 days, but who had logged in and used the service frequently.
The Execution
Groove came up with several data-driven attempts at lowering churn. For starters, they used emails to target users whose first sessions were under 2 minutes, as depicted below:

Groove’s offer to help these users through the setup process resulted in a 26% response rate. Of the users who went on to complete the process, over 40% stuck around after 30 days.
The company also sent the following email to users who logged in fewer than 2 times within the first 10 days:

This email had a response rate around 15%, and almost half of those who responded were still using the service after 30 days. Groove was so happy with the effectiveness of these emails, they decided to integrate similar tactics into the for every new user.
When it came to the RFM of time spent on a specific task, Groove hypothesized that the customers who took considerably longer were encountering problems of some kind. Rather than reaching out for help, those users simply quit.
To test this hypothesis, they sent the following email reaching out to users who spent much longer than average on a task in a single session:

This email received a 10% response rate, and 30% of the users who responded were still customers after 30 days.
Finally, Groove sent the following email to two groups—their most engaged users, and a random control group—around their referral program with a month free incentive: (minus the reference to usage):
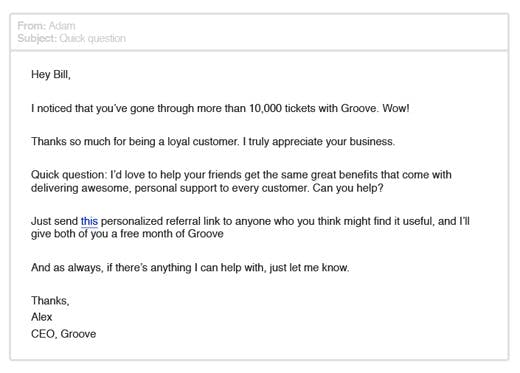
They found that their power users sent almost 400% more referrals than the control group.
Why Did This Happen?
By identifying the behaviors that signaled when customers were in danger of churning, Groove was able to set up interventions and retain some of those high risk users. Not only that, but they also increased referrals and rewarded power users by focusing on the opposite end of the engagement spectrum.
Actionable Advice
Want to print your doc?
This is not the way.
This is not the way.

Try clicking the ··· in the right corner or using a keyboard shortcut (
CtrlP
) instead.