Skip to content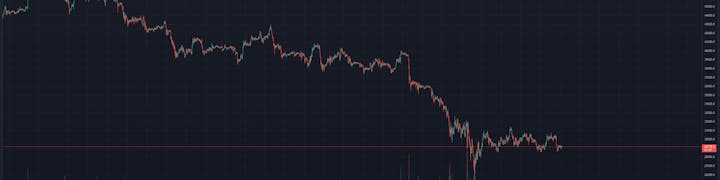
Start the grid ASAP to benefit from the big movementsWait for the market to take you some of the way first


Upper limit above the DCA bot average buy priceLower limit above current priceGrid spacing 1% to 1.5%Start after the initial post-dip rise starts to stagnate
Share
Explore

Last update: (UK)
31/05/2021, 2:00 PM
2022-05-21 NOTE
I wrote this during the 2021 bull market and whilst it is still a good solution to extracting value from losing positions it is perhaps less suitable as a “set & forget” solution during bear markets. The principle of using the grid to recover funds is still sound, but it would be better to run them intermittently and short the entire position during the steepest drops. I have yet to find a grid trading platform that can automate this process, so it is currently a manual activity. I may explore running a short bot at the same time as a grid and making use of 3Commas new ability to run grids with inactive orders (i.e. such that funds are available to the short bot).
A) Scenario
So your 3Commas DCA bots have left you with some -40% red bags from the recent BTC dump. What do you do?
Add funds?
You might already have done this and now have a frighteningly large deal size and no spare USD.
Wait it out?
Historically this usually works, but what if that was the peak and there’s a 2-year bear market ahead?
Sell at a loss?
Always an option - and can be a good one if you catch the first of a successive series of dips - but this is an unrecoverable loss. You can reinvest the released cash elsewhere, but that can lead to an unplanned chase to find the best coins and be counterproductive (e.g. )
Run a recovery grid?
If it looks like a long wait then this is my preferred option. Let me explain...
B) What is a grid bot?
This is a question often asked so I’ve included a brief explainer here - skip this section if you already know your way around a grid bot.
Basics
A grid bot is a series of buy & sell limit orders that are set out between an upper and lower limit, and which regenerate each time they are activated.
Grids will stop trading if the price rises above the high limit or falls below the low limit. They can always be adjusted to follow the market and they don’t hold red bags.
The following GIF from 3Commas shows the principles of a grid pretty clearly:
The idea is that you buy on one line and sell on the one above - making a small profit on the transaction. And repeat. And repeat again. And again...
As an example, say we have a grid bot with total investment of $2000, configured with 40 gridlines and 1% spacing per gridline. Each gridline would represent a $50 transaction, and each time the price rises from one gridline to the one above, it will sell $50.5 ($0.5 being 1% profit).
Example
Total Investment
Gridlines
Grid Spacing
$ per gridline
Profit per gridline
$2,000.00
40
1%
$50.00
$0.50
There are no rows in this table
So in this example, after 4000 transactions at $0.5 profit each, the grid will have made a 100% return on the total investment.
I’ve ignored fees and some other nuances in the above for simplicity, but hopefully you get the idea.
In reality the price will likely have changed as well, but in simplistic terms the function of the grid is explained by the grid transactions.
If the general price trend is upwards, the net profit will be greater than the value of the grid transactions (as you will be holding BASE currency which is appreciating). If the general trend is downwards, the net profit will be lower than the value of the grid transactions (as you will be holding BASE currency which is depreciating).
Remember though that since you are selling all the way up, the quantity of BASE currency in your grid is changing with each transaction. A grid would therefore lose out to buy & hold in a vertical price rise. Equally, you are buying on the way down, so a grid would do better than buy & hold in a sudden drop.
If the price exits the grid from the top you will hold only QUOTE, having sold all the BASE currency on the way up. If the price exits from the bottom then you will hold only BASE, having bought on the way down.
Quote Currency
Grids can be run with any QUOTE currency (e.g. USDT, BUSD, ETH, BTC, BNB), but they need volatility to profit. An altcoin grid running against USDT for example might have a greater total volatility than one run against BTC, but since the altcoin price trend might be more closely aligned with BTC, the BTC grid could perhaps be run with a narrower overall span. The grid transaction profit may still be greater from the USDT grid, but if BTC is appreciating then your BTC grid will be taking profit in an appreciating asset.
BASE/USDT:

BASE/BTC:

Operation
Grids like time. If the price stays on the grid then with enough time you will almost always end up in profit.
Let’s say our $2000 grid above generates 1% per day average return from the total investment. These are hypothetical numbers, but that’s pretty achievable. If the coin price at the start and end of the day is the same then this is 1% per day net profit.
If the price has risen then you will have additional gains proportional to the rise (NB. as above these are not directly proportional however, as you are selling some on the way up).
If the price has fallen, provided the average fall is not more than the 1% per day grid profit, you will still end up in profit overall.
Even if you have to move the grid down (potentially selling at a partial loss), you can still end up in profit after a few more days of grid transactions.
Since the bot takes profit between each pair of gridlines and not on the entire transaction (as with a DCA bot), the price could fall by 20% but if this stays within your grid you will still generate a small profit output on the next 1% rise. This allows a grid bot to never get “stuck” in the way that a DCA bot does.
If any of this isn’t clear then I'd recommend setting a couple of grids up on the paper account and watching them for a few days. Grids are pretty intuitive and it will give you a good idea of what to expect.
In normal circumstances it is typical to start a grid with a good proportion of gridlines both above and below the current price - that way it can buy and sell and keep working regardless of the initial price movements. In the “recovery grid” scenario we have a different strategy...
C) Recovery grid
Why?
The concept here is that either the dip was so deep - or the market so uncertain - that all indications suggest it will take months for the red bags to recover. In reality it will likely be quicker than you fear, but it can take a long time. I’ve had some deals in the past that I’ve waited 3 months to reach their original TP% - they did clear, but that was a long wait.
Where a grid excels is in profiting on all the small price fluctuations as the price slowly recovers ...and either side of a big dip the fluctuations are usually larger than normal.
Where to set the lower limit?
For a recovery grid, you would set the low limit above the current price. The idea with a grid in this situation is that you want it to both buy and sell, just not to buy any more than you originally had.
When you start the grid above the current price, all the gridlines will initially be created as "sell" gridlines. As the price rises, you will sell off some of the coin at these points, and the gridlines below will turn into "buy" gridlines. If the price falls again you will then re-buy up to the same amount. If it falls back off the bottom of the grid you will have the original quantity of the coin, plus the small amount of profit generated along the way.
If the price stays on the grid and bounces around then you will keep making these small profits, and after a period of time these - in addition to any price recovery - will entirely offset the original "loss" from the DCA bot.
Where to set the upper limit?
There are two “risks” with a recovery grid. One is that the price crashes a huge amount more - hard to predict, and in which case you would have been better off selling at a reduced loss. This is no different to the original DCA bot transaction though. The other is if the top limit is too low and the price rises so rapidly that it exits the top of your grid having made only a few transactions. Since you’re selling all the way up, this could mean that you end up selling at a net loss.

One way to mitigate this is to set the upper limit of your grid above the average buy price from your DCA bot transaction. This isn’t a perfect method, but since we’re considering this because it is unlikely to reach that value, it is a reasonable guide.

Support & resistance levels can also be a good guide to previous price movements. They aren’t as readily observed after a huge dip, but there is logic in using them to inform the grid positioning.
Equally, if the upper limit is too high then the profitability will suffer. Sometimes a compromise has to be made (e.g. keep the upper limit low and bank on the coin having a slow recovery).
Narrower span = higher ongoing grid profit, provided the price stays within the grid.
I’ll run through an example further on.
How many gridlines?
Personally I backtest this in Bitsgap, looking for periods with “typical” price movement (as opposed to the large swings in-and-around the dip). I then test many different grid quantities - typically from say 0.5% spacing all the way up to perhaps 3% spacing - to see what look best for the particular coin.
If you’re working with 3Commas only then a reasonable guide is to aim for grid spacing of 1% to 1.5%.
One other consideration here is minimum transaction values. Binance has a $10 minimum on transactions, so if your deal is only say $120, you will be limited to 12 grids maximum. You can deal with this by increasing the grid spacing - it will impact returns, but often not as much as you would expect - or by combining multiple deals.
I’m going to run through most of my 60 grid-able red bags soon and start adding the results to the sub-page
When to start?
There are a couple of approaches here, and either has its merits:
ASAP
The first strategy is fairly active. Say you realise the scale of the issue during the drop - the DCA bot is already -20% and market confidence is low. At that point you could configure a grid just above the current price and edit it whilst watching the charts (e.g. point A on my diagram below). With the grid ready, you could then set it going on the first hint of a bounce (point B) and it might pick up a decent number of transactions within a very short period. The prices might then dip again and fall out of the grid - at which point you could repeat. This series of “false starts” might gain back significant profit.

I marked the above up on a BTC chart simply because I had it open, but in hindsight, a grid set at that point with a 20% span would have been perfect for the last week! Hindsight is unrealistic though else we would all have perfectly bought the dip! 😈
Let the market work for you
Personally though, I find that I have less time to manage this process and/or have too many deals running and/or the dips happen in the middle of the night. Therefore I tend to go with the second option and wait a little while before configuring the grid.
For the second option, you let the market to recover a decent percentage first, then set the grid running once it starts to stagnate. Better initial starting point = narrower span. Narrower span = higher ongoing grid profit.
For example, this is the coin I will run through in more detail below:

It had a reasonably straight rise of 65% or so from the bottom - much more to gain from holding the coin in that circumstance than from a grid.
As an aside, I’m writing this before starting the grid and I clearly should have set it running on the 25th or perhaps 26th as the grid would have picked up some good profit during the subsequent period, but I’ve been focused elsewhere and wasn’t desperate to rush into this so I don’t think I’m losing out too much.
What is the aim?
At the start I said this was to deal with -40% from a DCA bot, so let’s use that as an example.
If the coin we purchased in our original deal is only worth 60% of the original amount then we need it to increase by 66.6% to get back to our original 100%.
Therefore we can treat a 66.6% increase as our break-even point and anything beyond that will be profit. It may be that this works very slowly and we are desperate to close the grid once it reaches (or is near to reaching) break-even. Alternatively it may be that we stumble across a coin with price action that really suits a grid and keep running it on a longer term basis.
I use both Bitsgap and 3Commas for grids. Bitsgap gives very clear profit information so is easier to work with in this scenario. 3Commas does not give very clear profit information, so I set up a “recovery grid calculator” to try and assist in tracking progress against the target.
The recovery grid calculator is Tab M on my Profit Tracking and Compounding spreadsheet:
What about the DCA deals?
One option is to just cancel the deal (NB. not “sell at market price”). This gets rid of the red bags and frees up the bot for more deals (provided you have available capital). If you have several pages of deals then this is the neatest option.
Alternatively you can just leave the deal running and use it as a benchmark. If you do leave the deal running you can treat it as a race between the grid and the DCA bot - makes it more fun than staring at red bags (although if the DCA bot "wins" it means nothing as by that point you will have sold most of the coin in the grid and you just have to cancel the DCA deal and leave the grid running for another week or two)!
Note that if you do leave the deal running you will have to enable trailing profit in order for this to work or the coin will be locked in a limit order on the exchange.
D) Worked Example
I have about 80 deals still to clear from the May 19th/21st dip. Probably 20 of those will clear themselves, the rest I need to deal with. Here’s one that I have from a few bots:

I actually have this on 8 deals. These were a mix of USDT & BUSD, but for the purposes of a grid I will use BUSD as it is .
Adding these deals to my grid calculator, I get an average buy price of 1.350, and a total deal volume of $1108.

Adding the current price of EPS at 0.823, and a target profit of 1% (why not at this point!), this tells me I am $433 down on my investment and need a 65.73% increase to reach the 1% profit.

These are the target figures I will then use to set out my grid.
3Commas
Setting this out on 3Commas, using the target price as the upper limit and aiming for 1% to 1.5% spacing, I end up with the following:

Using just the target profit as an upper limit doesn’t intersect with any support or resistance levels - stretching the grid too much will harm the profitability, but there may be some sense in raising the upper limit here to at least pick up a few of the troughs above.
This is with the upper limit at 1.75:

Or perhaps a slightly lower compromise at 1.65:

Increasing the total span has also increased the grid spacing a little. 1.26% to 2.44% may be fine. Personally I will backtest this on Bitsgap, but if I just had 3Commas I would likely increase this to 50 gridlines:

Bitsgap Backtest
This is Bitsgap’s default backtest results for the same range:

As you can see it’s a little uninformative as the coin was rarely on the grid.
We therefore need to find a section of the chart within the 1-month range we are able to test which has “average” movement. That will give us a better steer.
I’m going to target the period between perhaps the 10th & 17th May as it looks most “boring” and should therefore be more representative of a stable period of price increase we are expecting. To make the data representative I have moved the grid up, keeping the spacing and total span the same.
Zooming in on that period I’ve actually shortened the test dates to avoid the spikes on the 16th

So 7.5% in 5 days indicates this could be just over a 1% per day grid with this range & spacing (Bitsgap reports an average of 1.39% spacing).
We could leave it there, but since this is a real-world example, I will show you my real-world process. From the initial backtest above, I would then test the same range using multiple different grid spacings. I've added these to the table below for information:
EPS/BUSD
Grids
Spacing
Backtest Total
Backtest Days
% per day
Bitsgap
30
2.33%
7.23%
5
1.45%
40
1.74%
7.75%
5
1.55%
50
1.39%
7.55%
5
1.51%
60
1.16%
8.10%
5
1.62%
70
0.99%
8.51%
5
1.70%
80
0.87%
8.47%
5
1.69%
90
0.77%
8.46%
5
1.69%
No results from filter
So with BUSD and zero fees the tighter grids work well, with 70 grids and 1% spacing being the best.
There is a danger that you can focus far too much on the minutiae of grid spacings and miss the wider picture however. E.g. If the total grid range is out, then 60 grids vs 70 grids will make little difference.
What we can now do is make a more informed decision.
Setting it running
As I’m writing this the price has dropped a little again. Perhaps perfect timing to set the grid running if it follows the same pattern of the last couple of days.
Updating the calculator at the point I set it running, this tells me I am $449.89 away from my target.

This also highlights that I only have $669 to work with, so with Binance’s minimum order value of $10, I can only run 66 gridlines. I set this up as 65, but raised the lower limit just enough to ensure it didn’t drop below the current price - on Bitsgap this changes the grid quantity, so this actually saved as 64 grids.
I'm running the real bot on Bitsgap, but I have also set up a paper version on 3Commas to test out the tracker. One quirk of 3Commas is that if the lowest gridline is too close to the current price then it tries to create it as a “buy” gridline.
The first screenshot below shows the green “buy” line, even though it is above the current price:

To save this as a “sell” gridline I had to move it up to 0.819:

Results
Wish I knew! I’ll update this when I have some information...
Update 1 - 2021-05-28_0547
So half a day after starting, EPS has dropped a little. Given the movement over the last couple of days, this might be a good opportunity to drop the lower limit and pick up a few more trades in this current range.

On Bitsgap this is telling me the investment is -6.34% down on the start position, but it did make one grid trade generating the huge sum of $0.12!

Since we have dropped off the grid there is nothing confusing about tracking the profit in 3Commas at this stage. We actually made 0 trades on the 3Commas grid, so all we are doing is re-setting our start position.
I’m going to pick 0.777 as the new low limit. The current price is 0.772, so in the grid tracker I now need to update the start price to 0.772:

Updating this on Bitsgap I have to cancel the grid, then re-create it. In doing this it picks up that since the total value of EPS is I have is lower again, I can no longer run 64 gridlines. Doing this quickly, I therefore simply reduced the quantity of gridlines to suit the available funds:

The spacing has increased a little but the backtest showed us that whilst we might improve the performance a little with tighter spacing, it is not hyper-critical. Setting the grid running again, Bitsgap provides the following information:

The status is telling me that I am out of range (off the bottom) and since it sees this as a new grid it has reset the profit tracking information. Since I only had $0.12 grid profit this doesn’t make any real difference to me here, but on longer term grids this is one area where I prefer the 3Commas reporting.
In my 3Commas paper bot, I can simply edit the bot and change the lower limit to 0.777 and it will continue running as it was. This isn’t giving me a warning about the amount of EPS, but most likely I just had more EPS in my paper account.

If there are no major market moves then I’ll probably leave these for a few days now and focus on getting a few more grids running - it’s a lot quicker without the screenshots & narrative!
If the market rises then I’ll leave the grid exactly as it is. If the market falls again - and looks like it will keep doing so - then we might need to re-visit the strategy and start being more pro-active in following the movement down. I’m in no rush with this though - I’m expecting it to take a month or two to get to a close-out position.
Update 2 - 2021-05-31_1039
I left this grid as it was for a few days. The price dropped lower but I didn’t want to sell too cheaply so waited for it to come back up. A few screenshots showing the progression below:
2021-05-29_2113
Not a successful restart yet!


2021-05-30_0956
Still waiting. EPS is +20% or so today.


2021-05-30_1051
Back to the grid now.

Zooming in to the 1-min chart you can see the transactions:

Status:

2021-05-30_1905
1-hr:

1-min:

Status:

2021-05-30_2147
1-hr:

1-min:

Status:

2021-05-31_1037
1-hr

1-min:

Status:

So currently the total value is 39.58% up on when I re-started the grid, against my target of 76.6%. Most of this has been the coin price increase, but it has also added $49 to my account from grid transactions. If the market falls again and the price drops off the grid then I would still have $49 more than if I had not run the grid.
For reference, the DCA bot would currently be showing me a -20% red bag. That’s a big improvement from the start position and not slower than the grid at this point, but a grid is much more fun!
Update 3 - 2021-05-31_1353
One item I missed off the second update was a comparison between how the Bitsgap (real) grid is doing against the 3Commas (paper) version.
Bitsgap:

3Commas:

So the Bitsgap grid has returned 8.45% grid profit, versus the 3Commas grid with only 2% grid profit. Why is this?
The answer is grid spacing. Bitsgap has a constant 1.24% spacing throughout the range, whereas 3c uses constant distance (1.75% when low on the grid and 0.83% when high on the grid).
At this point in the process it looks as though the Bitsgap grid is superior, but if the market recovery continues and the price rises higher up the grid then the the opposite should start to happen.
E) Developed Versions
Once you get the hang of grids and using them for DCA recovery you can develop your methods to suit your approach.
Lower Upper Limit
I set up the above process and example as a “safe” way to do this without risking the coin running off the top of the grid. A higher-risk but faster approach is to keep the upper limit lower than the entry price if you believe that it will hit enough resistance along the way to hit your target total profit before exiting the top of the grid. If planned well and the price follows expectations then you can easily double the daily grid profits by doing this.
For my EPS grid for example we could set the upper limit at say 1.3. Using our same test date-range as above, this would be a 2% per day grid and could easily get us out in half the time. EPS hasn’t looked particularly lively on the recovery so it might be a good coin to risk this on.

Using Bitsgap - as I have for my example above - you can do this with less of a risk by making use of the “trailing-up” function. This will allow the grid to automatically follow the price movement if it does run off the top of the grid. You can do this manually in 3Commas but it takes a bit more effort.
Trailing isn’t perfect as you are always buying at the top (when the price fall back into the grid) so there are some small losses that have to be balanced out by grid transaction profits, but in the majority of cases it works very well.
Two Grids
Another option after a deep dip might be to set up 2 grids. One wider-spanning grid at a higher level to pick up the bulk of the movement once the rise has slowed, and one actively-managed smaller grid following the price at the bottom of the dip (as per my ASAP example under “When to start”).
The upper grid could be the “safe” one with say 80% of the funds and the lower grid could be a high-risk one with say 20% of the funds. If the price shoots through the small grid then it’s not a catastrophe, but a grid running in the most volatile period might easily make a 50% profit within a couple of days. Maybe something to play with if you’re prone to boredom!
Varying the grid
Another option is to set a single grid starting at the lowest point, but increase the lower limit as the price rises. This might trigger a few buys along the way and it will be increasing the average purchase price (even if a buy is not triggered when editing, the “buy” gridline below would be higher than it was before), but time on the grid and improved daily profits should offset this. The risk here is that the price drops off the bottom again and then you could be in a worse position than you started.
F) TL;DR
Some people might prefer this version! 🙈
G) Other Pages
This is a database of Bitsgap backtests I’ve been running. The plan is to keep this updated with every backtest I run.
Links to the grid calculator I used above as well as my QFL test page
H) Disclaimer
As ever, this is my opinion, not financial advice!
Want to print your doc?
This is not the way.
This is not the way.

Try clicking the ··· in the right corner or using a keyboard shortcut (
CtrlP
) instead.