Share
Explore
2022 KP People Report
 Metrics
Highlights
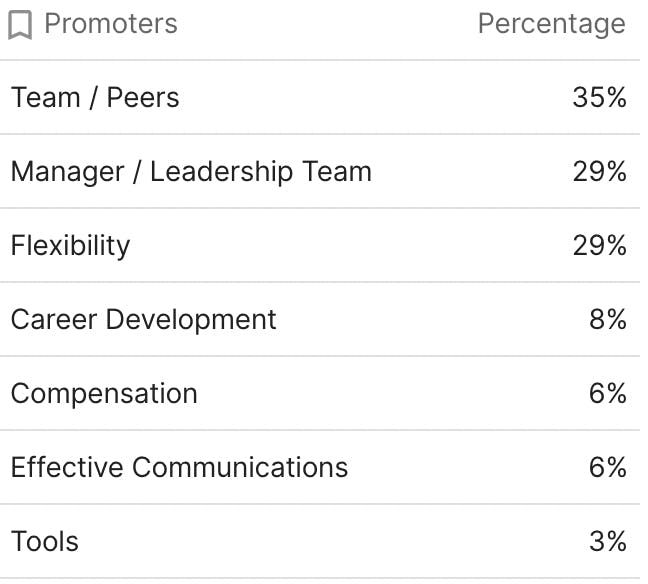
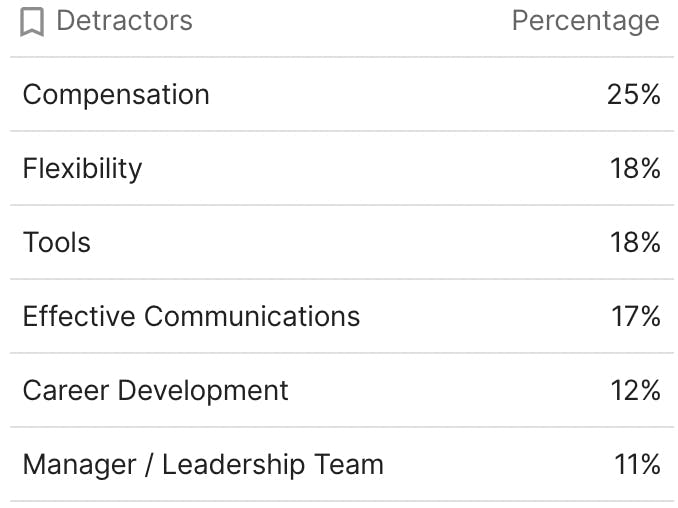
eNPS Score
Span of Control
Changes in Compensation Strategy
Recruiting Metrics
“Oftentimes, companies will attach themselves to the wrong signals. For high growth companies, I'd highly recommend focusing on funnel conversion rates over most other recruiting metrics, including # of hires. When managed appropriately, funnel conversion will directly impact candidate quality and time to hire. Even more so, a healthy funnel conversion will allow teams to accurately forecast # of hires over time, as well as gain efficiency in total interviewing hours—which in and of itself can accelerate a business.”

Other
Company Size
% of Companies that Offer a WFH Stipend
Min
Max
Average
1
1-25
22%
300
3000
1650
2
26-50
23%
75
1000
442
3
51-100
24%
150
2000
790
4
101-200
38%
400
1200
642
5
201-500
24%
500
2400
932
6
500+
40%
500
1800
1025
There are no rows in this table
Want to print your doc?
This is not the way.
This is not the way.

Try clicking the ⋯ next to your doc name or using a keyboard shortcut (
CtrlP
) instead.