Skip to content
User retention: % of new users who are still active 3-6 months laterLogo retention: % of new companies who are still active 3-6 months later
Invite rate: % of new users who sent at least one invite in the first X daysInvite conversion rate: % of users who receive an invite that sign-up in the next X daysVirality factor: % of new users who have come from an invite
Traffic: Visits to site/weekMoM user growth: Month over month growth rate in total usersActivation: % new users who “activate”, whatever that means for your product
MRR: Total and MoM MRR growthARR: Total and MoM ARR growthNew customers: New customers/week
Customer retention: % of new paying customers who are still customers 3-6 months laterNet Dollar Retention: MRR of each cohort at 12 months
Paid company conversion: % of free companies that convert to paid within X daysPayback period: Average time to pay back CACGross margins: Net sales revenue minus the cost of goods sold
DAU/MAUKey actions per day/week (e.g. tasks created, pics sent)Average time spent/user/day
Invite volume: When an invite was sent, median number of invites sent per userVelocity of virality: Median days from 1 —> N seats at a companyTraction: Number of total companies with at least 3 users signed-upLeads: Top domain name with most users (to target outreach)
ARPU: Average revenue per userUser conversion: % of free users that convert to paid within X daysGrowth spend efficiency: CAC/LTVSpeed to next tier: If usage-based pricing, speed to next tier/planCompany adoption: Number of users per domain name
Landing conversion: % visitors click CTAActivation: % visitors who “activate”, whatever that means for your product% visitors complete your sign-up flow% visitors signup
 Metrics
Pre-revenue:
1. Retention
2. Virality within an organization
3. Top-of-funnel growth
Post-revenue:
1. Revenue growth
2. Retention
3. Monetization
Additional metrics to track and have available:
1. Engagement
2. Virality within an organization
3. Monetization
4. Funnel conversion
🛠 What tool should founders use to track their metrics AND 🎨 How do I best visualize and share these metrics?
I put a call out on Twitter asking SaaS founders to share their metrics dashboards:

Below I’ve synthesized the best examples, and grouped them by the tools that these teams use to track these metrics. Surprisingly (though not that surprisingly) Google Sheets was by far the most used tool, followed by Profitwell and Google Data Studio (sitting on top of Google Sheets). If you have any more examples to share, !
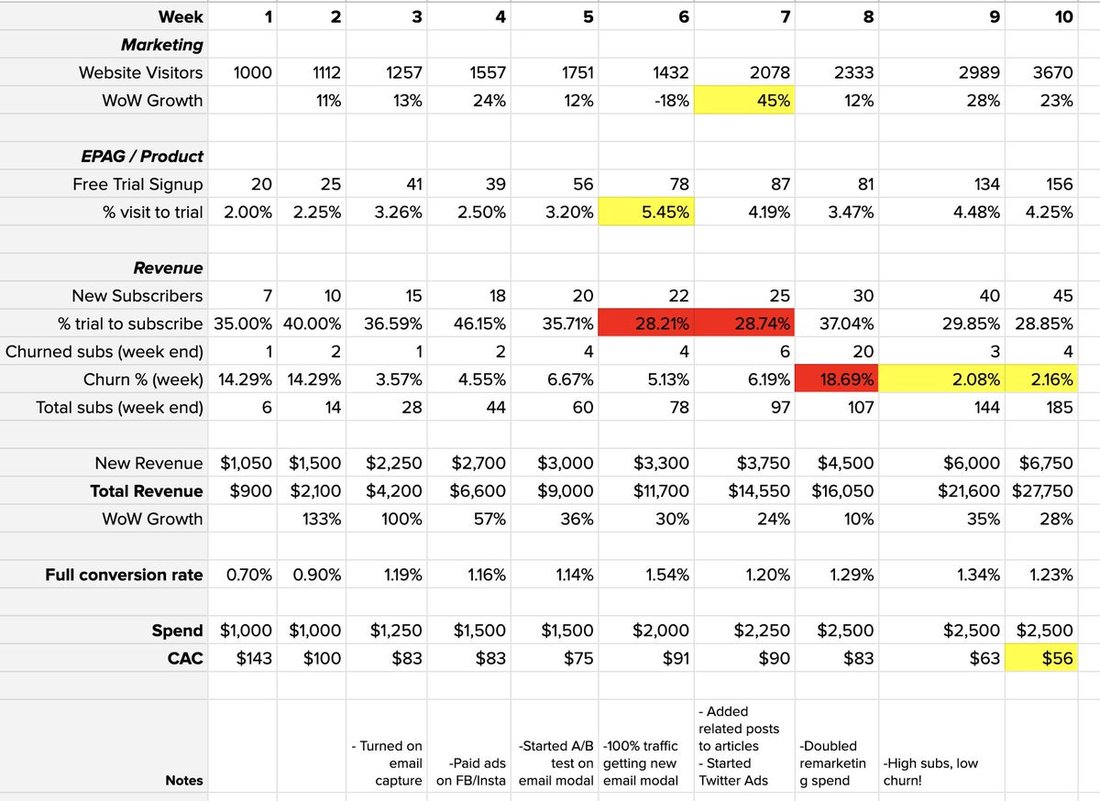
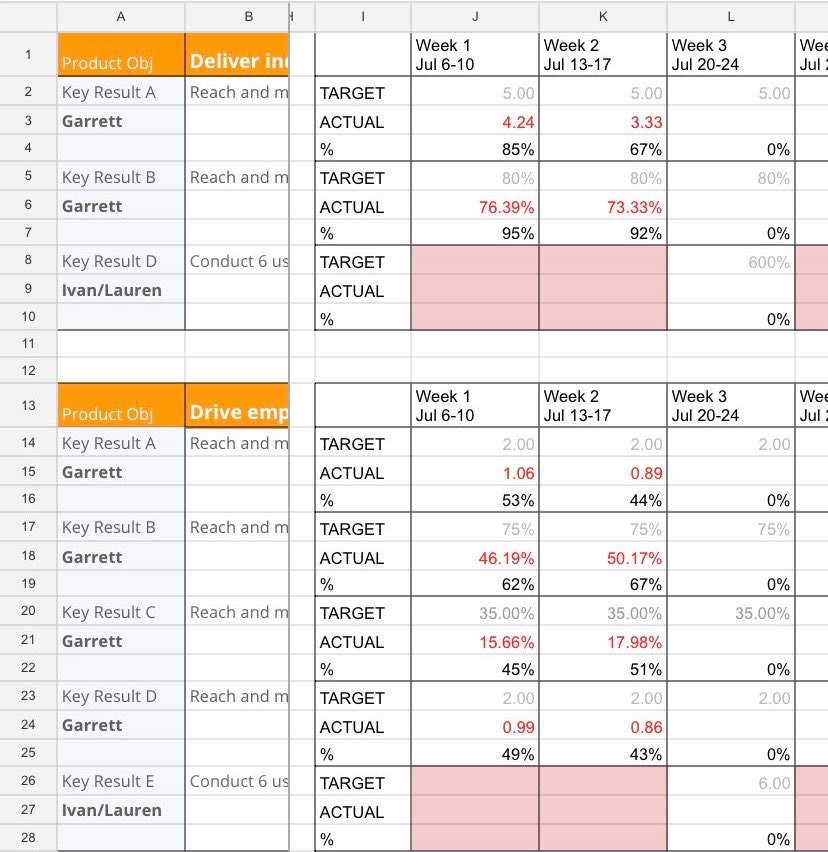
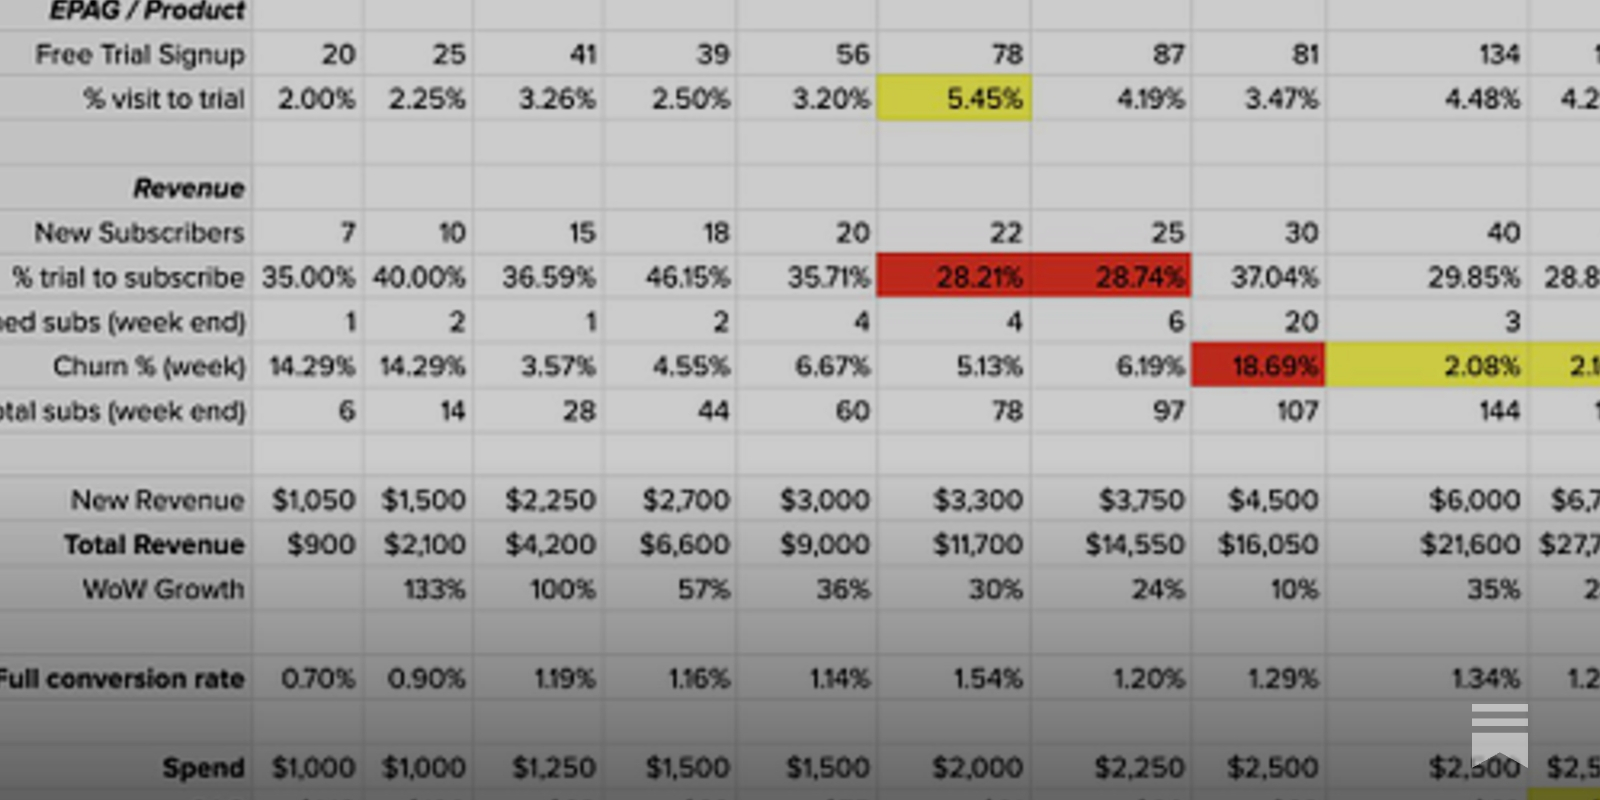
1. Google Sheets
Table 7
Column 1
There are no rows in this table
Table 8
Column 1
There are no rows in this table
Want to print your doc?
This is not the way.
This is not the way.

Try clicking the ··· in the right corner or using a keyboard shortcut (
CtrlP
) instead.