Skip to content
🔬 What metrics should early-stage bottom-up SaaS founders focus on?🛠 What tools should they use to track their metrics?🎨 How does one best visualize and share these metrics?
User retention: % of new users who are still active 3-6 months laterLogo retention: % of new companies who are still active 3-6 months later
Invite rate: % of new users who sent at least one invite in the first X daysInvite conversion rate: % of users who receive an invite that sign-up in the next X daysVirality factor: % of new users who have come from an invite
Traffic: Visits to site/weekMoM user growth: Month over month growth rate in total usersActivation: % new users who “activate”, whatever that means for your product
MRR: Total and MoM MRR growthARR: Total and MoM ARR growthNew customers: New customers/week
Customer retention: % of new paying customers who are still customers 3-6 months laterNet Dollar Retention: MRR of each cohort at 12 months
Paid company conversion: % of free companies that convert to paid within X daysPayback period: Average time to pay back CACGross margins: Net sales revenue minus the cost of goods sold
DAU/MAUKey actions per day/week (e.g. tasks created, pics sent)Average time spent/user/day
Invite volume: When an invite was sent, median number of invites sent per userVelocity of virality: Median days from 1 —> N seats at a companyTraction: Number of total companies with at least 3 users signed-upLeads: Top domain name with most users (to target outreach)
ARPU: Average revenue per userUser conversion: % of free users that convert to paid within X daysGrowth spend efficiency: CAC/LTVSpeed to next tier: If usage-based pricing, speed to next tier/planCompany adoption: Number of users per domain name
Landing conversion: % visitors click CTAActivation: % visitors who “activate”, whatever that means for your product% visitors complete your sign-up flow% visitors signup
 The most important bottom-up SaaS metrics to track (and how to best visualize them) – Issue 48
👋 Hello, I’m , and welcome to a 🔒 subscriber-only edition 🔒 of my weekly newsletter. Each week I tackle reader questions about product, growth, working with humans, and anything else that’s stressing you out at the office. and in return I’ll humbly offer actionable real-talk advice 🤜🤛
Q: I’m curious what metrics early-stage bottom-up SaaS startups track and how they visualize these metrics –– especially metrics other than MRR and revenue?
With so many tools, potential metrics to track, and perspectives on measuring your progress, it’s no surprise founders often struggle to know where to start.
Not having run a SaaS startup myself, I came at this question from a few directions: crowdsourcing the answer, asking my smartest founder friends, and doing a bit of primary research. Below you’ll find answers to the following three questions
I don’t have all of the answers so I’d love to hear from you. Is there anything below that looks off or incomplete? I’ll use this post as a living document and update it with anything I learn. Just reply to this email, leave a comment, or . I would love to make this the most accurate and actionable list of recommendations for founders of bottom-up SaaS companies.
🔬 What metrics should early-stage bottom-up SaaS founders focus on?
Below are the most important metrics ranked in priority order, divided into three buckets: pre-revenue, post-revenue, and additional metrics to track. You don’t need to track all of these immediately — pick a few to start with and add more over time.
Pre-revenue:
1. Retention
2. Virality within an organization
3. Top-of-funnel growth
Post-revenue:
1. Revenue growth
2. Retention
3. Monetization
Additional metrics to track and have available:
1. Engagement
2. Virality within an organization
3. Monetization
4. Funnel conversion
🤓 Further study for later-stage or sales-driven companies
🛠 What tool should founders use to track their metrics AND 🎨 How do I best visualize and share these metrics?
I put a call out on Twitter asking SaaS founders to share their metrics dashboards:
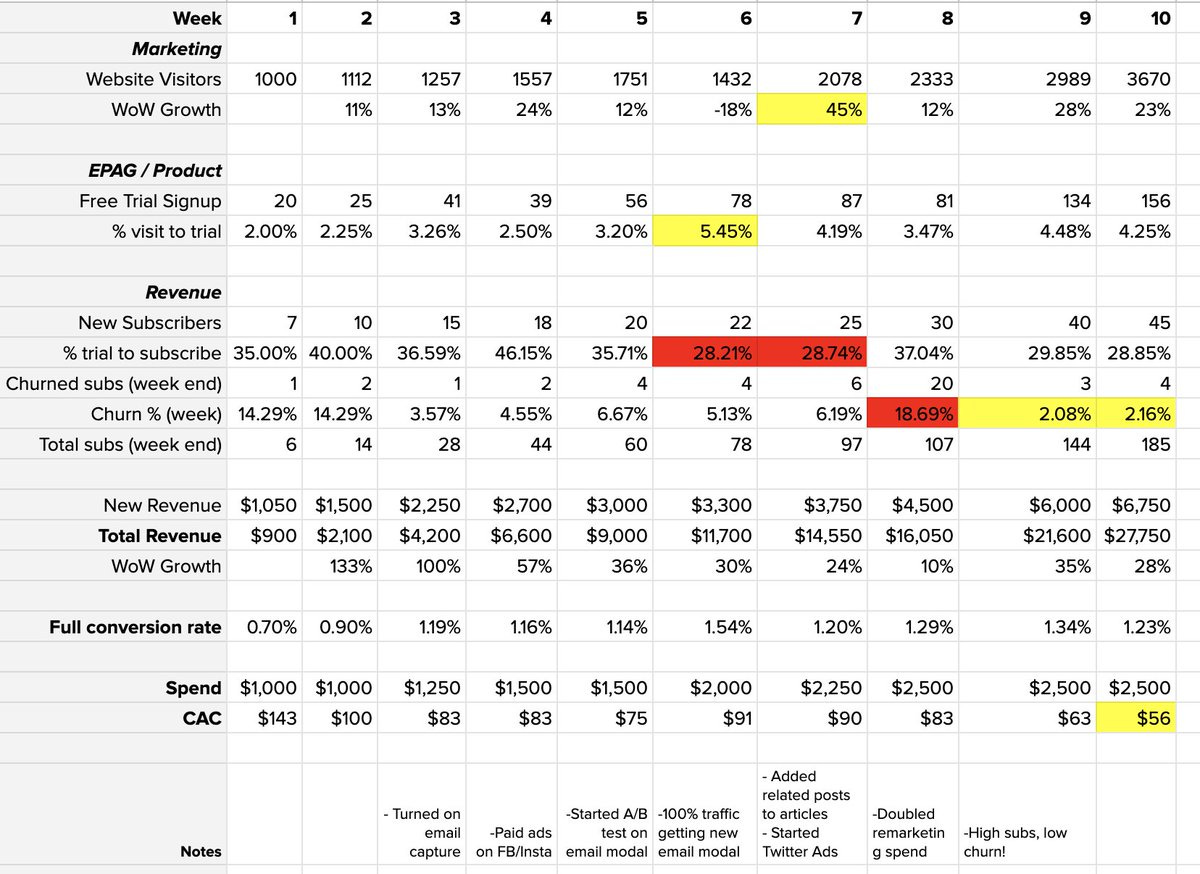
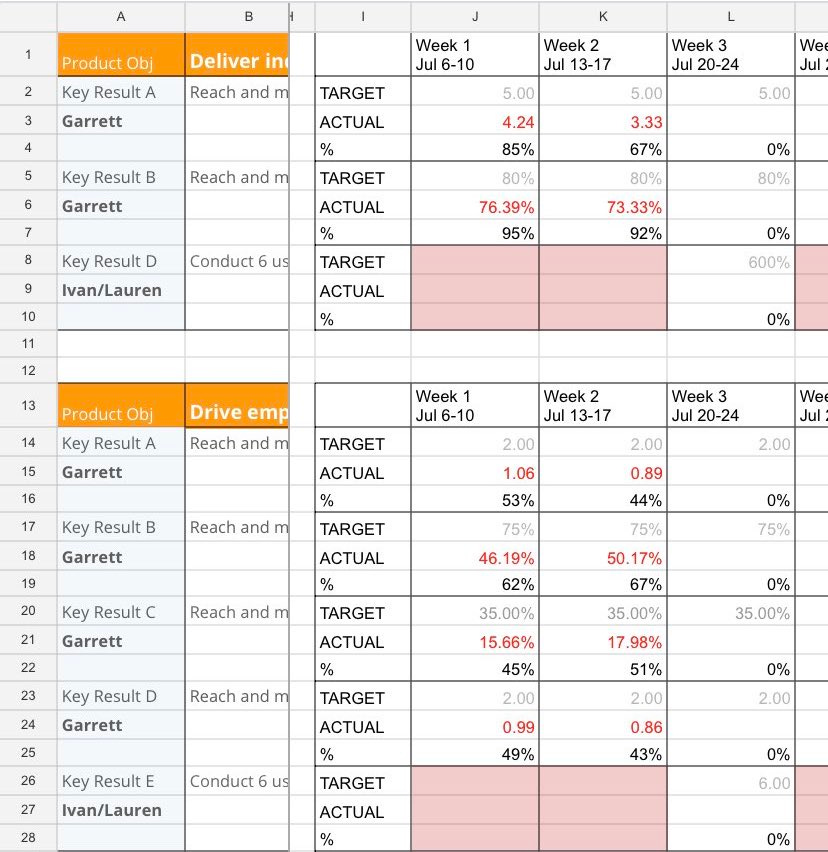
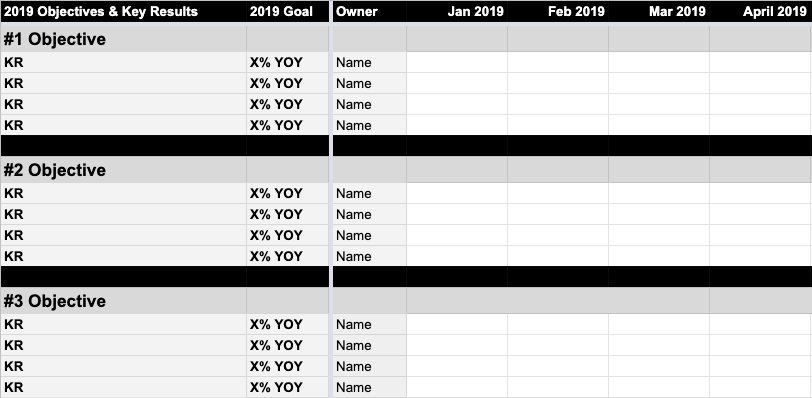
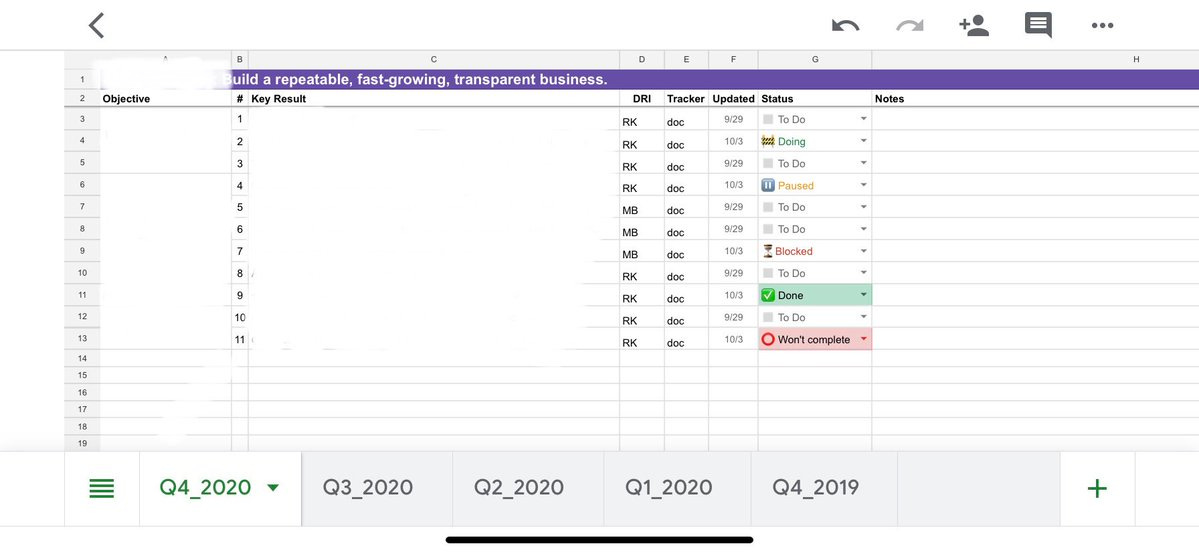
Below I’ve synthesized the best examples, and grouped them by the tools that these teams use to track these metrics. Surprisingly (though not that surprisingly) Google Sheets was by far the most used tool, followed by Profitwell and Google Data Studio (sitting on top of Google Sheets). If you have any more examples to share, !
1. Google Sheets
2. Profitwell
almost exclusively. It was super helpful in the acquisition to have a 3rd party metric source I'd share a screenshot but I don't think the acquirer would appreciate that 😂
October 2nd 2020
14 Likes
3. Google Data Studio
Other: Mixpanel, Looker, Tableau, Anaplan, Causal, Slack
for anyone to do it (& more). Will check if I can dm more traditional dashboards from our day jobs though (cc @Brieuc_lambert)
October 3rd 2020
1 Retweet8 Likes
Want to print your doc?
This is not the way.
This is not the way.

Try clicking the ··· in the right corner or using a keyboard shortcut (
CtrlP
) instead.


