Skip to content


1. How many complaints have been generated?
#### Question 1 ####
####Question 1.1: How many complaints have been generated? ####
#Load and clean the data
url6 <- '/Users/mofei/Desktop/IE9113 DA/Assignment & R Code/Assignment 6/Consumer_Complaints.csv'
complaints = read.csv(url6,header=TRUE, stringsAsFactors=TRUE,na.strings='NA')
dim(complaints)
> dim(complaints)
[1] 257341 18
257341 complaints have been generated.
2. How many are unique or recurring?
####Question 1.2: How many are unique or recurring? ####
####When Product, Sub Product, Issue, Sub Issue, Company are the same, we regarded them as recurring
#Select Product, Sub Product, Issue, Sub Issue, Company Column
complaints.0 = complaints[,c(2,3,4,5,8)]
#Count number of duplicate rows
p=complaints.0 %>%
group_by(Product,Sub.product,Issue,Sub.issue,Company) %>%
summarise(
n= n()
)
#Arrenge
p_sort=arrange(p,desc(n))
p_unique=p_sort %>% filter(n == 1)
p_recurred=p_sort %>% filter(n != 1)
#Sum unique and recurred number of rows
n_unique=sum(p_unique$n)
n_recurred=sum(p_recurred$n)
n_unique
n_recurred
> n_unique
[1] 19933
> n_recurred
[1] 237408
There are 237408 recurring data and 19933 unique data.

For recurred complaints, most are Credit reporting problems, especially, incorrectly information complaints.
3. Using "Consumer.complaint.narrative", what can you say about the type of complaints in this report?
##########################
### Preprocessing
##########################
#create a corpus
require (quanteda)
help(corpus)
names(complaints)
#create a corpus with metadata
newscorpus<- corpus(complaints$Consumer.complaint.narrative,
docnames=complaints$Complaint.ID,
docvar=data.frame(Date.received=complaints$Date.received,
Product=complaints$Product,
Sub.product=complaints$Sub.product,
Issue=complaints$Issue,
Sub.issue=complaints$Sub.issue,
Company=complaints$Company,
State=complaints$State,
Submitted.via=complaints$Submitted.via))
names(newscorpus)
summary(newscorpus) #summary of corpus
#create document feature matrix from clean corpus + stem
help(dfm)
dfm.simple<- dfm(newscorpus,
remove = stopwords("english"),
verbose=TRUE)
topfeatures(dfm.simple, n=50)

# create a custom dictionary
swlist = c("xxxx", "xx","called", "also", "can", "pay", "paid", "said","call", "made", "days", "now", "s", "still", "date","told","one","make","tri")
dfm<- dfm(newscorpus,
remove = c(swlist,stopwords("english")),
verbose=TRUE,
stem=FALSE)
topfeatures(dfm, n=50)

1. From the top features after creating a custom dictionary, it has been noticed that customers mentioned a lot about their account, credit, report, payment, information and loan.
2. The top words might be sound neutral and descriptive when customers state their complaints, but could guide the company to divert to specific departments.
3. The potential problems could be found with negative words like “dispute” and “never”.
4. The next step could be carried out by going through from more words and negative words to their related contexts.
3.1 More Words:
#update for bigrans using tokens
toks.1<-tokens(newscorpus) #creates tokens
toks.2<-tokens_remove(toks.1, c(swlist,stopwords("english"))) #remove stop words from tokens
toks.3 <-tokens_ngrams(toks.2, n=2) # ngram =2
dfm.ngram2<- dfm(toks.3, verbose=TRUE)
topfeatures(dfm.ngram2, n=50)

Still, credit, report and cards are the top feature words. However, there are some more informative words like “Wells Fargo”, “credit score”, and “never received”.
3.2 Negative Word Context
#exploration in context
kwic(newscorpus, "dispute", 2) #Keywords in context
kwic(newscorpus , "never", window = 3)
“Dispute” context:

“Never” context:

From the word “dispute”, it could be found that problems like equifax issue, request letter, conformation information, and etc are the company need to pay more attention to.
From the word “never”, some complaints about missing mention information, bankruptcy, disbursements, missing response, utility issue, and etc are the company should find a way to solve.
4. What type of product issues & complaints are the most frequent?
##### Question 1.4: What type of product issues & complaints are the most frequent? ####
i=p=complaints.0 %>%
group_by(Issue) %>%
summarise(
n= n()
)
i_sort=arrange(i,desc(n))
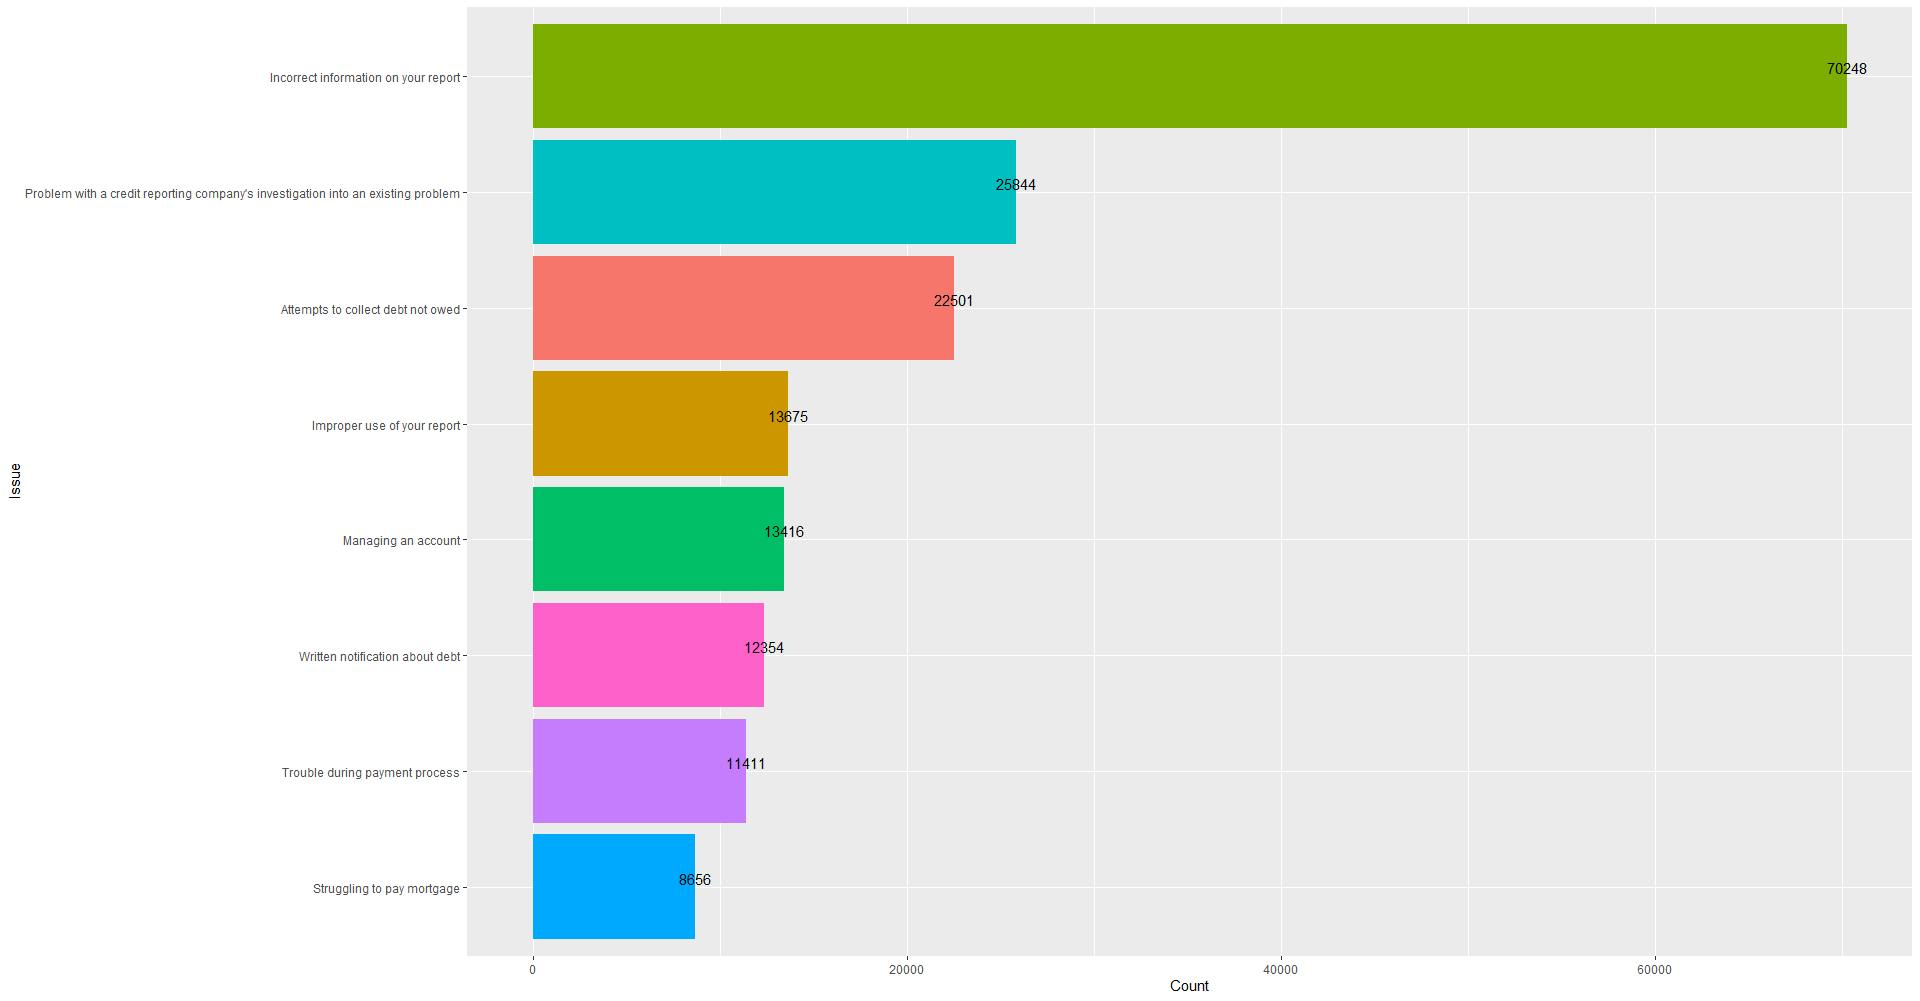
#Barplot
i_sort %>%
head(8) %>%
ggplot(aes(x = fct_reorder(Issue, n,.desc=FALSE), y = n, fill = Issue)) +
geom_col() +
geom_text(aes(label = n), vjust = -0.25) +
theme(legend.position = "none")+
xlab("Issue") + ylab("Count")+
coord_flip()
For product issues and complaints, the most frequent Issue is “Incorrect information on report”.
i_sort_10=i_sort %>%
head(10)
p2=complaints.0 %>%
group_by(Product,Issue) %>%
summarise(
n= n()
) %>%
arrange(desc(n))
p2=p2 %>% filter(Issue %in% i_sort_10$Issue)
p2 %>%
ggplot(aes(x = fct_reorder(Issue, n,.desc=TRUE), y = n, fill = Product)) +
geom_col() +
theme(legend.position = "bottom")+
xlab("Issue") + ylab("Count")+
ggtitle("Product VS top 10 Issues")+
coord_flip()
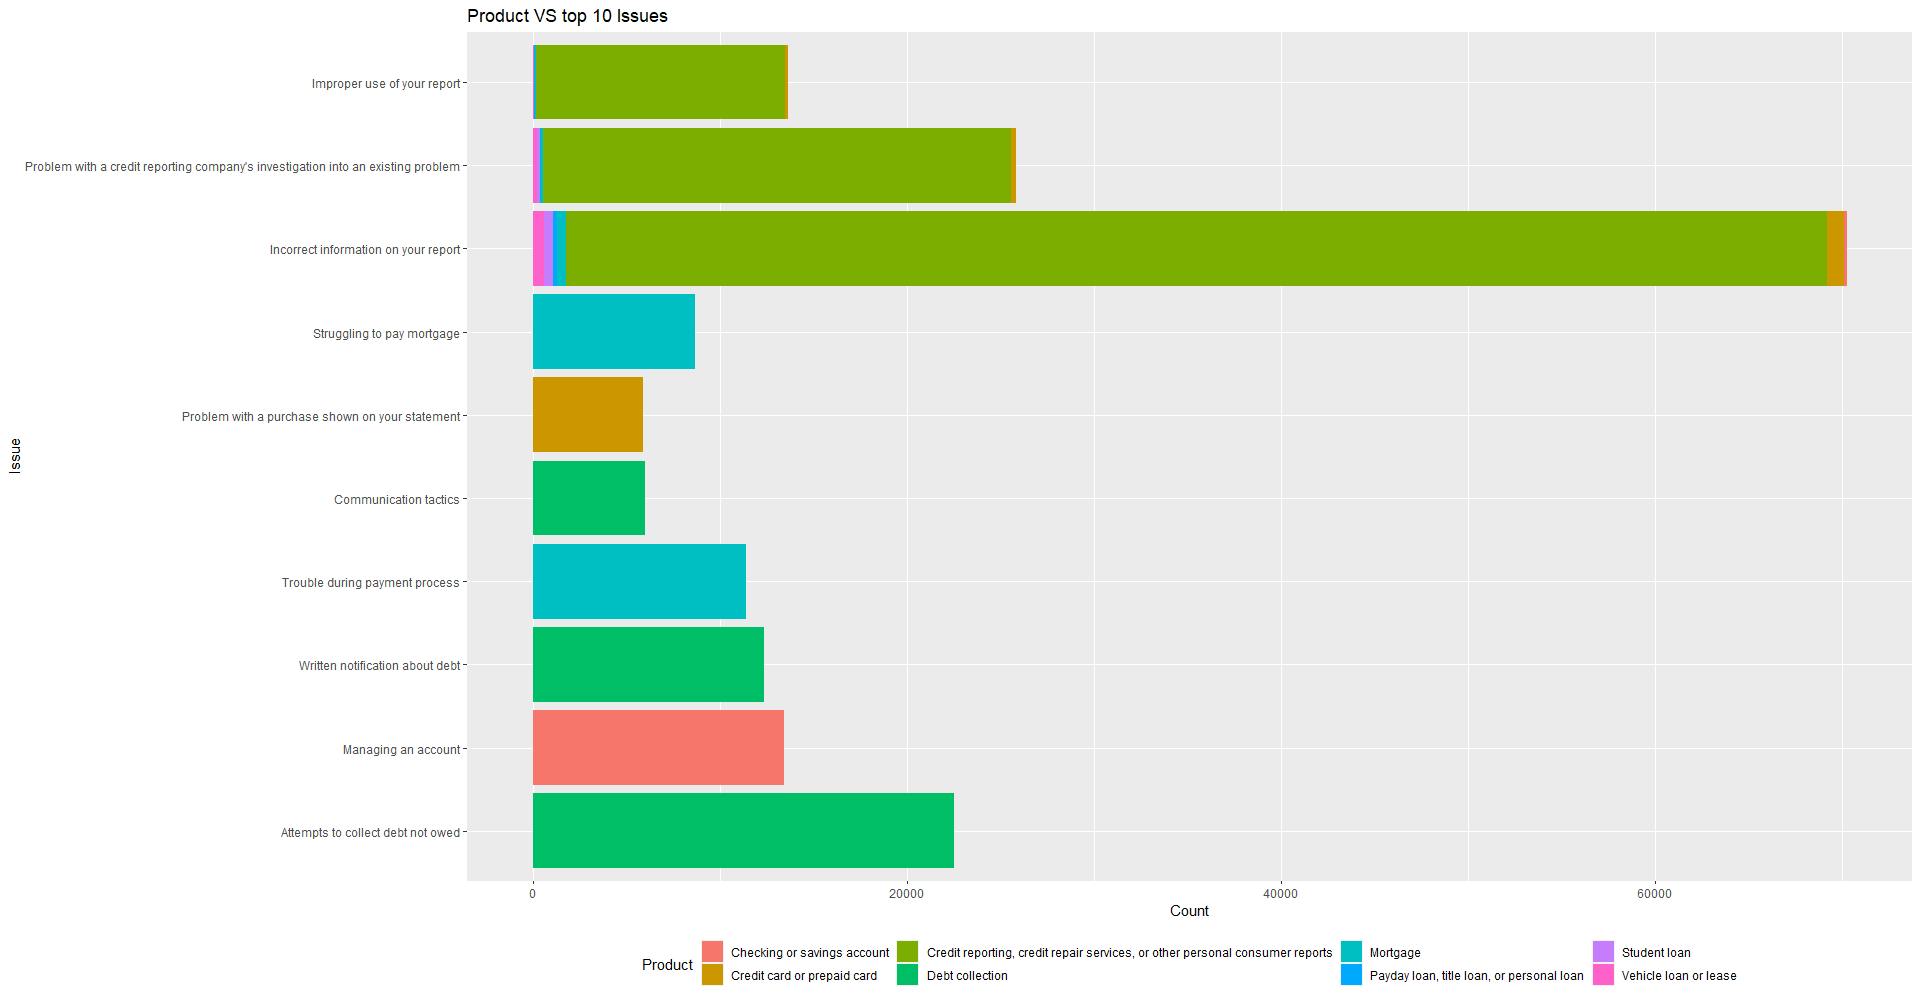
For product issues and complaints, the most frequent product in “Incorrect information on report” is “Credit reporting, credit repair services, or other personal consumer reports”
5. Complete a sentiment analysis for all the types of complaint submissions observed during this year.
#####Question 1.5: Complete a sentiment analysis for all the types of complaint submissions observed during this year. ####
#####Sentiment Analysis####
mydict2 <- dictionary(list(negative = c("don","didn","detriment*", "bad*", "awful*", "terrib*", "horribl*"),
positive = c("best","love","good", "great", "super*", "excellent", "yay")))
dfm.sentiment2 <- dfm(newscorpus,
remove = c(swlist,stopwords("english")),
verbose=TRUE,
dictionary = mydict2,
stem=FALSE)
> topfeatures(dfm.sentiment2)
posit negat
23252 5640
# to evaluate sparcity
require(tm)
dfm.tm2<-convert(dfm.ngram2, to="tm")
dfm.sparse2<-removeSparseTerms(dfm.tm2,0.7)
dfm.sparse2
#####specifying a correlation limit of 0.5
findAssocs(dfm.tm2,c("life","colleg*","stori"),corlimit=0.5)
####word cloud#####
set.seed(100)
freq2<-topfeatures(dfm.ngram2, n=200)
wordcloud(words = names(freq2), freq=freq2, min.freq = 0.5,
max.words=500, random.order=FALSE, rot.per=0,
scale=c(6,0.3),size = 2,
colors=brewer.pal(8, "Dark2"))

1. By the analysis, there are 23250 positive numbers and 640 negative values.
2. After sparcity and specifying, the word cloud has been created as the figure shows with the most frequent word “credit_card”, “credit_reporting”. and “credit_bureaus”.
Want to print your doc?
This is not the way.
This is not the way.

Try clicking the ··· in the right corner or using a keyboard shortcut (
CtrlP
) instead.