Skip to content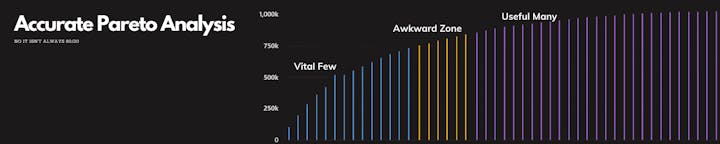

 there areunique businesses and worth of total sales, The Vital Few (The slope is greater than the linear relationship)The Awkward Zone (The slope is near the linear relationship)The Useful Many (The slope is less than the linear relationship)
 Overall Pareto Analysis & Breakpoint(s)
Choose the data you want to analyze!
Scenario Selected for Analysis:
All
Note: If this is blank, no data will be analyzed!
Contains: Records.
[ ]
Choose whether to include negative sales:
Only Positive Sales Included, Negative Sales Excluded.
Of theseof the sales are negative.
Understanding the Data
Breakpoint Indicators
How do you know the Vital Few from the Useful Many, and where is the Awkward Zone?
Generally this is differentiated when the slope pivots from increasing to flattening. We call these “breakpoints” or “breakpoint indicators”.
The Breakpoint Indicator for the current data is (as generated automatically by the slope from the first datapoint to the last datapoint). The Breakpoint Indicator is based on the data in this document and generated automatically.
Since ....
[ ]
0
If each business’ rank corresponded to a linear relationship to rank, for each change in rank the cumulative sales should grow by the breakpoint indicator ().
The breakpoint indicator is the slope of the line. Y=* X
If the slope (aka increase in sales by rank, aka ) is less than then the curve is flattening indicating where you might want to break the data into a group and if it grows higher, the curve is growing indicating a grouping.
Remember, traditionally there are three categories:
Adjusting Tolerances - Breakpoint Variation
As it is unlikely that you will find a point that the slope exactly equals we provide a “fudge factor” by allowing you to indicate the Breakpoint Variation, allow you to indicate a percentage percentage can vary, so you can easily create an “Awkward Zone”.
Currently in this analysis we are allowing an upper and lower variation of this breakpoint indicator by the Breakpoint Variation you indicate here:
percent
000
0Here are some presets:
Set Breakpoint Variation to 0%
Set Breakpoint Variation to 5%
Set Breakpoint Variation to 10%
Which means per your data the breakpoint(s) will vary by
0
And will encompass the increase in sales by rank from to .
0
0
The Risk of not having this:
The risk of not having an “Awkward Zone” or a Breakpoint Variation is that you will be too precise and miss a potential Vital Few or Useful Many because of an arbitrary decision (If something barely misses a category etc.
The use of the Breakpoint Variation and Awkward Zone allows you to be conservative or aggressive based on your need while having a basis for that decision, and allows you to have a 3rd zone to segment data by (useful in more gradual sloping situations).
Analysis
Categories
Breakpoint Indicator
Actual Percentages
Number In Group
Relative Impact - Sum
Business Sales Data - Sum
Min
Max Sales
Vital Few
49
0%
$1,029,466.80
-$197.70
$105,369.10
Awkward Zone
0
0%
$0.00
Useful Many
1
0%
-$551.80
-$551.80
-$551.80
There are no rows in this table
Cumulative Business Sales - Categories
Amount of Sales
Want to print your doc?
This is not the way.
This is not the way.

Try clicking the ··· in the right corner or using a keyboard shortcut (
CtrlP
) instead.