Skip to content
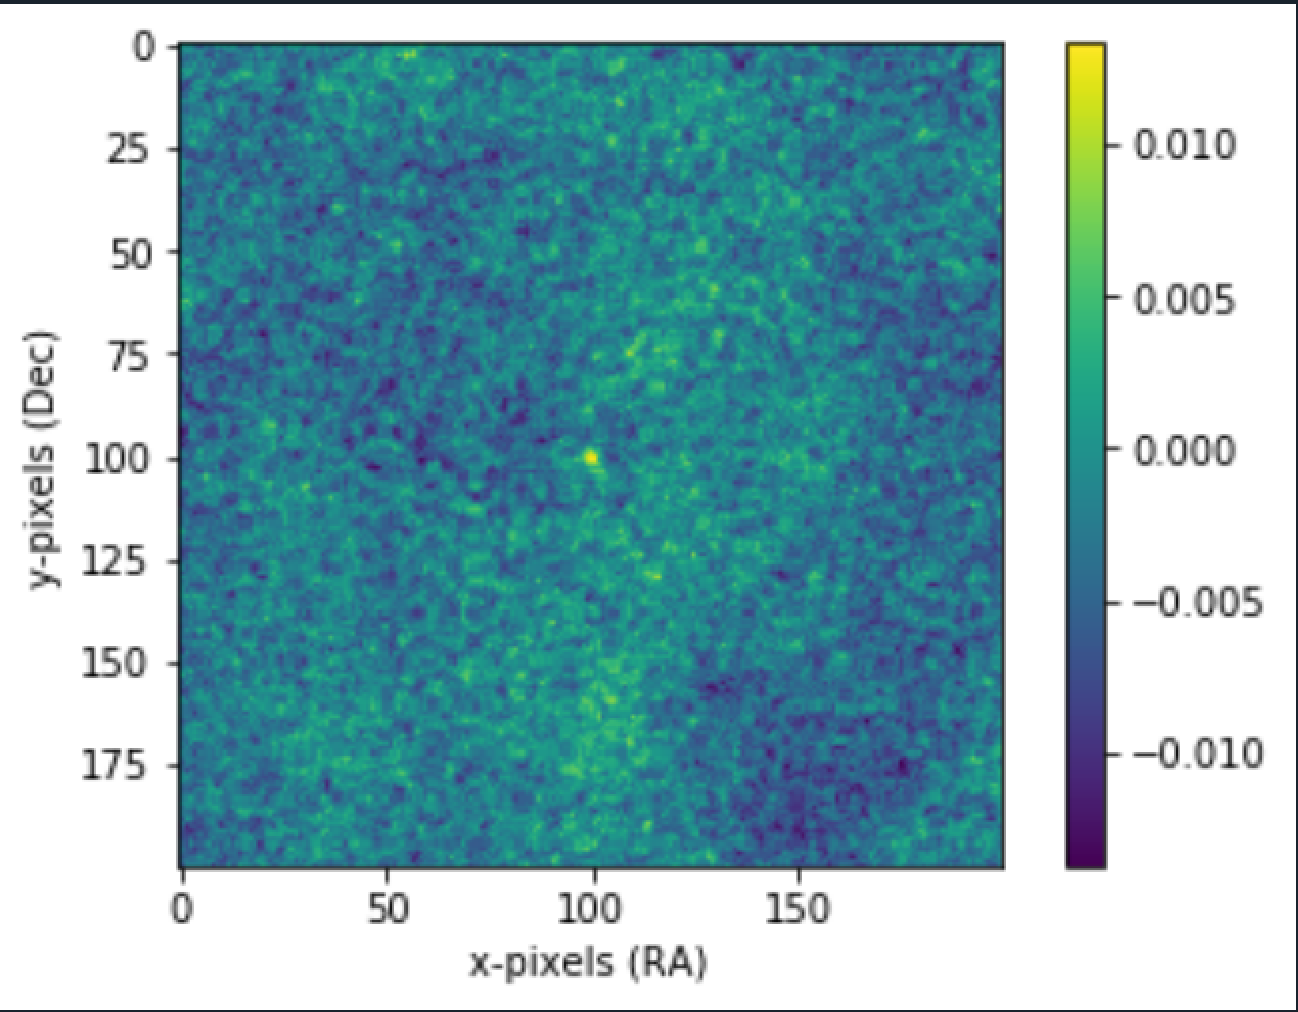
Pulsar Image (the center object)
 Detection of Pulsars using Median Image Stacking (Binapprox)
Pulsars are highly magnetic neutron stars. Because of their magnetism, they radiate 2 strong, steady beams of light. As the star spins, the beams of light sweeps in and out of our view, the star is observed as flickering. Think of it as like a lighthouse visible to someone on a boat.
Imagine a telescope taking hundreds of images of a part of a sky where a pulsar exists. In some of the images the object might be really faint and in some very bright. But this information isn't pure, it contains noise. Noise from the telescope itself for example, making images a bit different from what really exists. (In simple terms, i would explain it to be a change in brightness of an object, than what really was).

So how do we analyze this data to detect such an object? One of the popular methods is image stacking. For now, lets say, an image dimensions are of 200x200 (pixels )size, each pixel containing information such as color (0,255) from black to white. Typically images in astronomy are in the format called
.
If we have (lets say) 10 images of same part of the sky, each of them will have different noises. The pulsar image in the center may not even be visible in some images. The noises in the image are random, but the signal are not as they are coming from a source. So when you add these images pixel by pixel (stack them up) the random noise might reduce (it would be less in some and more in other images) and the signal with definitely increase (thereby increasing the signal to noise ratio, a more clearer picture emerges).
There are various methods for this, instead of just summing them up ( specially if you have not 10 but thousands of images instead, summing wont work). We can for eg., take Average of each pixel value also gives pretty decent picture of things. But imagine if some noise moved a pixel value to very high (very bright , close to 255), mean in such cases (outliers) will give a wrong picture as well.
Lets say you have an array of [1,2,3,4,5] . The mean is 3. But some distortion caused the last 5 to be 50. The array becomes: [1,2,3,4,50], the mean becomes 12. A big difference here! Can cause a wrong detection. (50 is an outlier value)
Second method is taking median of every pixel. To find median, the basic algorithm tells us to sort the values and then look at the mid value.
Median of [1,2,3,4,5] is 3 and median of [1,2,3,4,50] is also 3. Median is able to handle outlier values.
Easy Enough? The problem here is size and number of images. To sort each pixel value, we would need the complete data in memory. Lets imagine each pixel is of 8 bytes, you have an image of 200x200 = 40,000 pixels: = 8*40000 bytes. Having 10k images would mean: 8*40000*10000 bytes = 3,20,00,00,000 bytes = 3.2Gb which isn't feasible. In the Mean/Average method, we can calculate a running mean. Each file is brought in memory (only 8*40000 bytes = 320Kb), we can calculate the sum (320Kbs again, same size as the image), and in the end divide each cell by the number of images. But how do we do this with median? Running median calculation is complex than this. Here we will look at which approximates the median.
This article and the following sub-pages, covers all the learning during the project.
Go in the following order of articles to understand more:
I applied the algorithm to not only pulsar images (hard to find .fits files) but to some other fits files that i could find.
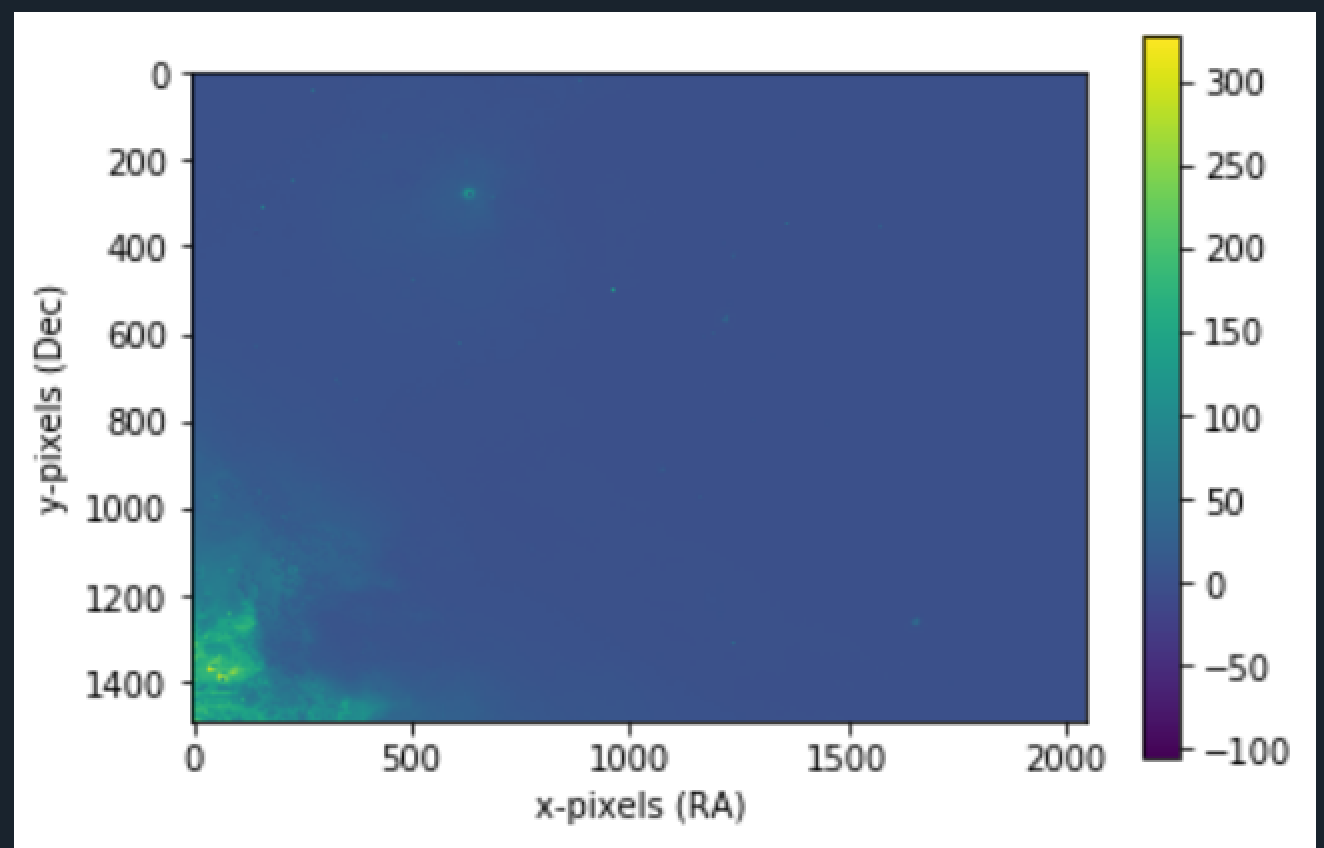
2. M42
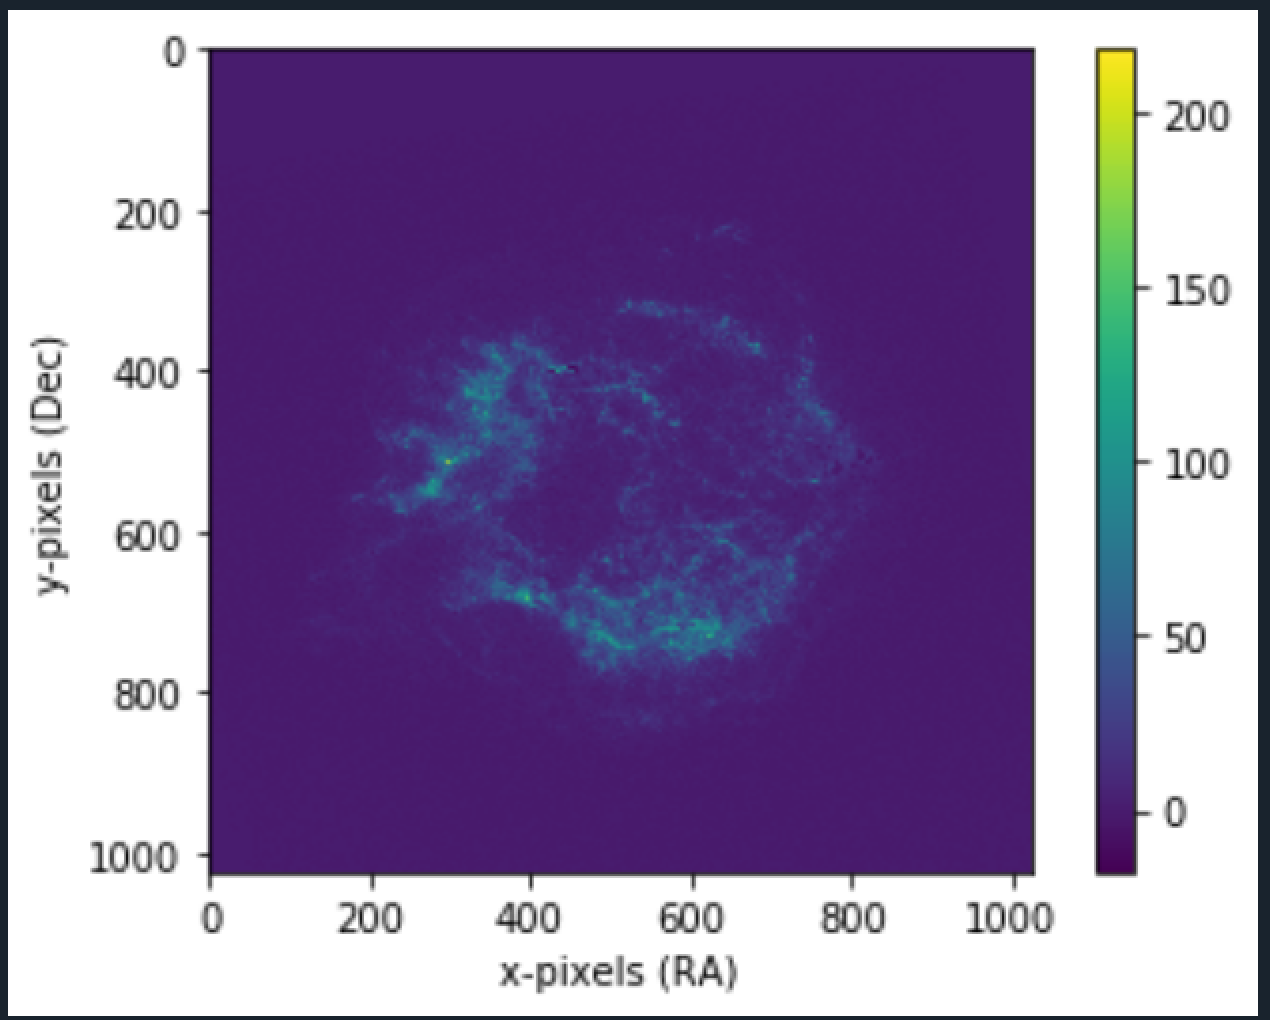
3. Crab Nebula
(FITS can be opened using the SAOImage DS9 Software available online)
RA and DEC are the coordiantes of sky wrt earth. More Info here: . The values are one of the data in FITS files. The legend values are derived from FITS as well and depends on the images you are processing. The more purple, the darker the area.
Finding FITS
Want to print your doc?
This is not the way.
This is not the way.

Try clicking the ··· in the right corner or using a keyboard shortcut (
CtrlP
) instead.