Skip to content
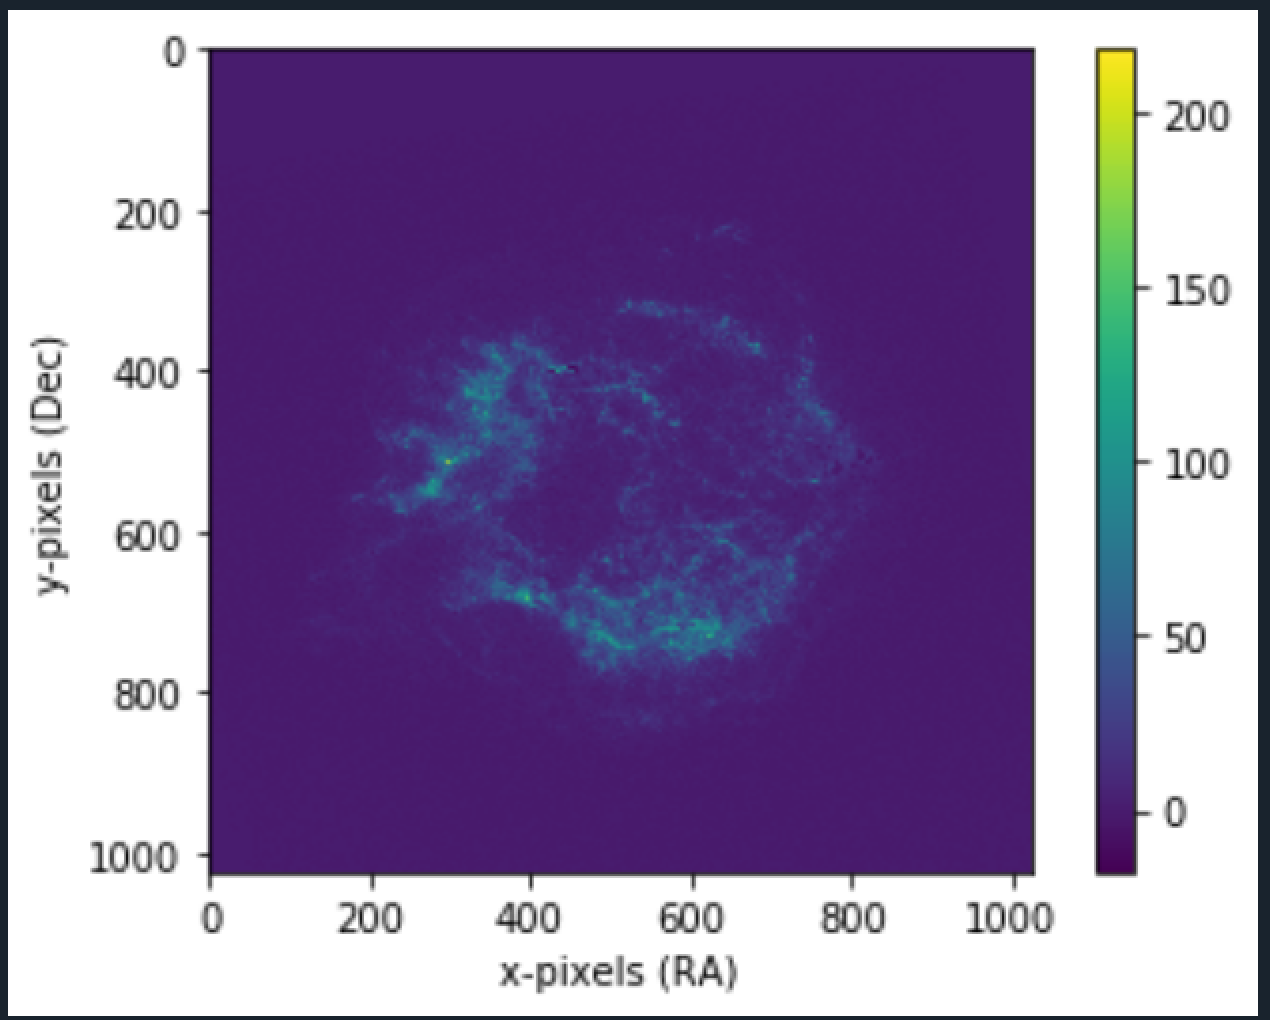
No of Bins = 4
 Median Image Stacking
We will now implement binapprox algorithm in 2D matrices. (Refer to BinApprox article for steps)
def calcMeanStdDev (imageArr):
mean = 0
count = 0
m2 = 0
for fname in imageArr :
data = load_fits(fname);
mat = np.array(data)
count += 1
delta = mat - mean;
mean += delta/count;
delta2 = mat - mean;
m2 += delta*delta2;
variance = m2/(count-1)
stdDev = np.sqrt(variance);
return mean, stdDev;
Note this contains the loading of files, each file is loaded once and closed (load function mentioned in Mean Image Stacking article).
Step 2: Form B bins across [mean-stddev, mean+stddev], mapping each data point to the bin
def binFunc (data, bins, mean, std, binWidth, leftBin):
m,n = data.shape;
for i in range(m):
for j in range(n):
p_mean = mean[i,j];
p_std = std[i,j];
p_bin_w = binWidth[i][j]
p_data = data[i][j];
if p_data < p_mean - p_std :
leftBin[i,j] +=1;
if(p_data >= p_mean - p_std and p_data < p_mean + p_std) :
index = int((p_data-(p_mean-p_std))/p_bin_w)
bins[i, j,index] +=1
return bins, leftBin;
def median_bins_fits(imageArr, noOfBins):
mean, stdDev = calcMeanStdDev(imageArr);
# minVal = mean - stdDev;
# maxVal = mean + stdDev;
binWidth = (2*stdDev)/noOfBins;
firstImage = load_fits(imageArr[0])
leftbin = np.zeros_like(firstImage)
m,n = leftbin.shape;
binsMat = np.zeros((m,n,noOfBins));
for fname in imageArr :
data = load_fits(fname);
mat = np.array(data);
print("image i:", fname)
binsMat, leftbin = binFunc(data, binsMat, mean, stdDev,binWidth, leftbin)
return mean, stdDev, leftbin, binsMat
I commented out minVal and maxVal which i previously used instead of p_mean - p_std calculations. I used . By removing those variables ( some other variables too that i used ) and directly using the values, I could reduce around 20Mb (I had too many variables).
Step 3,4: Find the bin that contains the median and return the midpoint.
def median_approx_fits (imageArray, noOfBins):
mean, std, left_bin, bins = median_bins_fits(imageArray, noOfBins);
m,n = mean.shape;
imageCount = len(imageArray);
mid = (imageCount + 1)/2;
median = np.zeros((m,n));
bin_width = (2 *std)/noOfBins;
for i in range(m):
for j in range(n):
count = left_bin[i,j]
for b, bincount in enumerate(bins[i, j]):
count += bincount
if count >= mid:
break
median[i, j] = mean[i, j] - std[i, j] + bin_width[i, j]*(b + 0.5)
#print(median)
return median;
_____________________________________________________________________________________________
More the number of bins, better the median approximate. Plotting the "median" matrix using our plot function (mentioned in Mean Image Stacking).
Using it on the Crab nebula image:
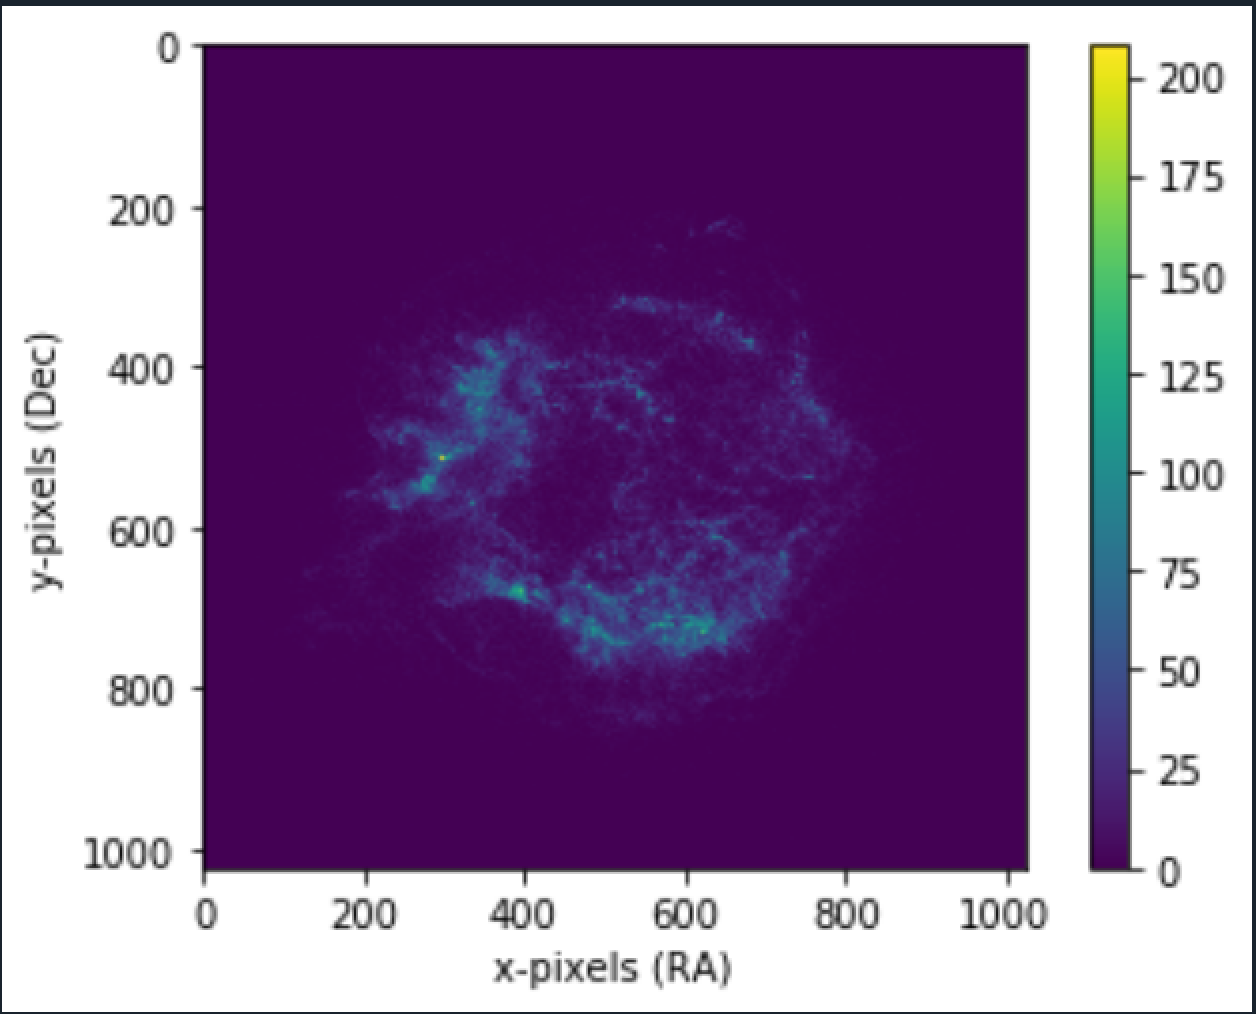
2. No of Bins = 50
3. Bins: 150
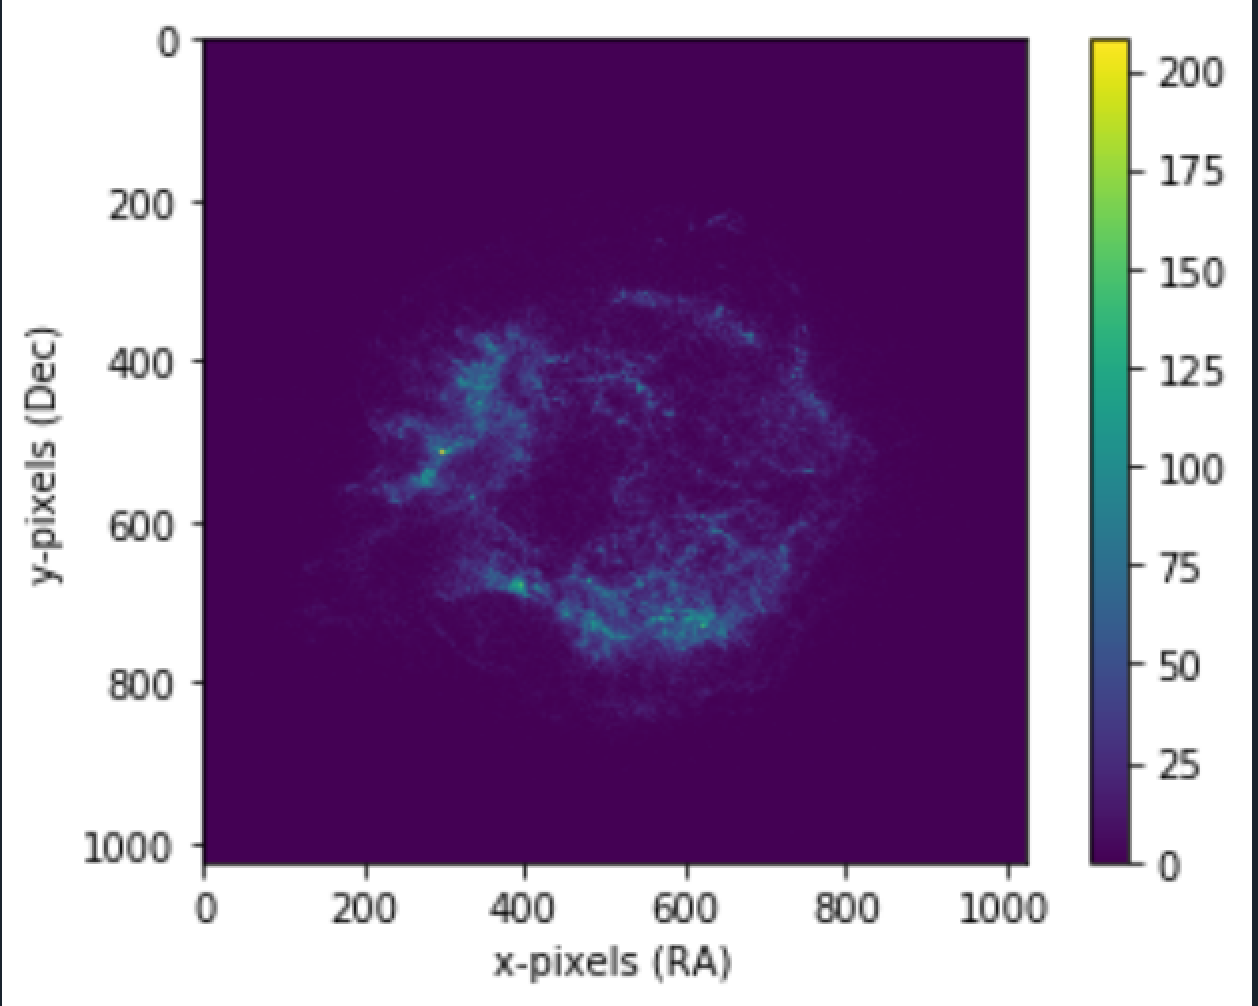
As number of bins increase, the brighter objects are more visible clearly, like in the left part of the image, we can see a very bright object at around RA = 250, Dec = 500 (Approx). Typically astronomers use no of bins to be around 1000 and use hundreds of images. They also optimize further by parallelizing calculations further.
(Found some fits a part of Data Driven Astronomy Online Course by The University of Sydney)
Want to print your doc?
This is not the way.
This is not the way.

Try clicking the ··· in the right corner or using a keyboard shortcut (
CtrlP
) instead.