Skip to content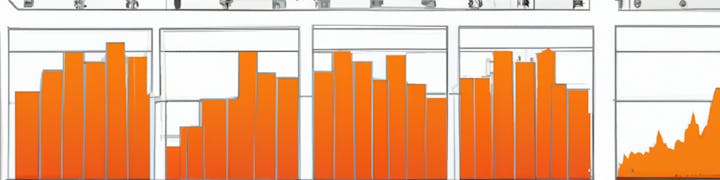
 Sample Visualization
Couple of ways to visualize the data
Coda allows you to visualize your data in different manner. Below are a couple examples to demonstrate the power of Coda, and you can learn more about their visualization feature
.Splat Points
Year:
Blank
Clear
Num In-Studio Classes (With HRM):
667
Average Splat:
16.43
Splat Points Per Class
Zone Distribution (% time in class)
Tread: Speed Over Time
💡 Is the chart not rendering? Make sure you enable block-level details, and hide the units on the main page.
Want to print your doc?
This is not the way.
This is not the way.

Try clicking the ··· in the right corner or using a keyboard shortcut (
CtrlP
) instead.