Discover Coda Features

icon picker
Explore Tables

Discover how to level up your tables in Coda.
Tables in Coda can be as powerful as your use case. Tables in Dropbox Paper can be great for organizing notes and content, and you can paste these onto a Coda doc to start layering with Coda’s functionality.
The example below shows very quick updates I made to get started on a table I copied over.

What are tables in Coda?

Tables in Coda function more like databases than spreadsheets. While Coda tables behave more like databases, users can view and manipulate their data with ease like in a spreadsheet.

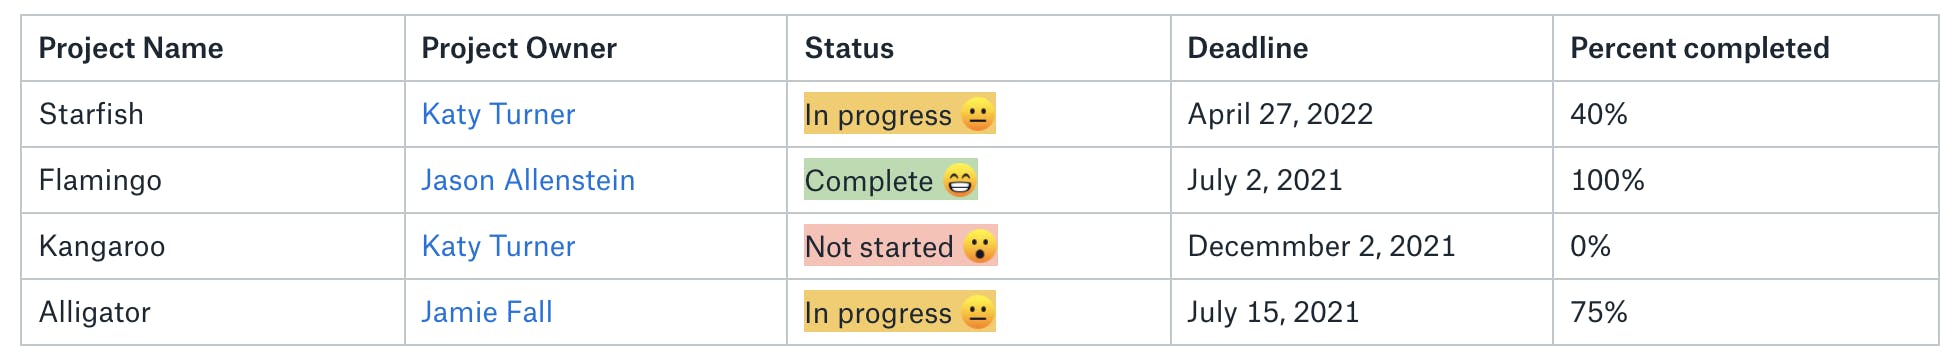
My milestone tracker in Paper:

image.png
Use case: lightweight project planning, reference point for small team meeting
Workflow:
Each Project Owner is responsible for updating the columns each week.
If the status changes, they will need to delete and re-color the text, and type in any updates to the other fields.
Sometimes the Project Owner forgets to make the update, so their manager will comment in the doc and ask them to do so when they can.

Copied over to Coda:
Project Name
Project Owner
Status
Deadline
Percent completed
1
Starfish
@Katy Turner
In progress 😐
April 27, 2022
40%
2
Flamingo
@Jason Allenstein
Complete 😁
July 2, 2021
100%
3
Kangaroo
@Katy Turner
Not started 😮
Decemmber 2, 2021
0%
4
Alligator
@Jamie Fall
In progress 😐
July 15, 2021
75%
There are no rows in this table

My milestone tracker in Coda. V1:

Use case: lightweight project planning, reference point for team meetings, manager review.
By making the below updates, the table is now more sustainable for growth. Team members can quickly add a new project, and the data is already formatted to match the type of information they are inputting. We can now start to grow and link this table depending on our use case.
Updates: minor changes to get my table started in Coda
Project Owner: changed to a people column (originally text)
Status: changed to a select list. Added conditional formatting so that the color coding is automatic.
Deadline: changed to a date.
Percent completed: changed the column type.
Example Milestones Table in Coda
0
Project Name
Project Owner
Status
Deadline
Percent completed
1
Flamingo
Jamie Fall
Complete 😁
7/2/2021
40%
2
Alligator
CR
Casey Roberts
In progress 😐
7/15/2021
100%
3
Kangaroo
Jason Allenstein
Not started 😮
12/2/2021
0%
4
Starfish
KT
Katy Turner
In progress 😐
4/27/2022
75%
There are no rows in this table

Milestone tracker. V2 and beyond:

From here, I can start to add features that will help my team to avoid duplication, manual entry, and provide our manager with real-time updates.
With the addition of table views, automations and formulas, our data can easily be up-to-date without manual input.
Here’s what’s possible for Milestone tracker version 2 and beyond:
Before
After (with Coda)
1
Each Project Owner is responsible for updating the columns each week.
This dashboard view is automatically updated, with data feeding into it from each project’s individual page.
2
If the status changes, they will need to delete and re-color the text, and type in any updates to the other fields.
The status and its color-coding are updated automatically. Formulas determine how many tasks are completed, and label any project off-track.
3
Sometimes the Project Owner forgets to make the update, so their manager will comment in the doc and ask them to do so when they can.
On Thursdays, the Project Owners are reminded via Slack to add any qualitative commentary to the metrics (which are auto-updated). On Fridays, the table is automatically emailed to the VP.
There are no rows in this table

If you’d like to see a larger milestone tracker brought to life or learn more, I’d recommend these docs in :
This link can't be embedded.
For more details on table features, check out this article (if you have’t already):

Up next:

Want to incorporate your Dropbox files?

Interested in a feature comparison?


Want to print your doc?
This is not the way.
Try clicking the ⋯ next to your doc name or using a keyboard shortcut (
CtrlP
) instead.