This page is about testing different parts of the configuration
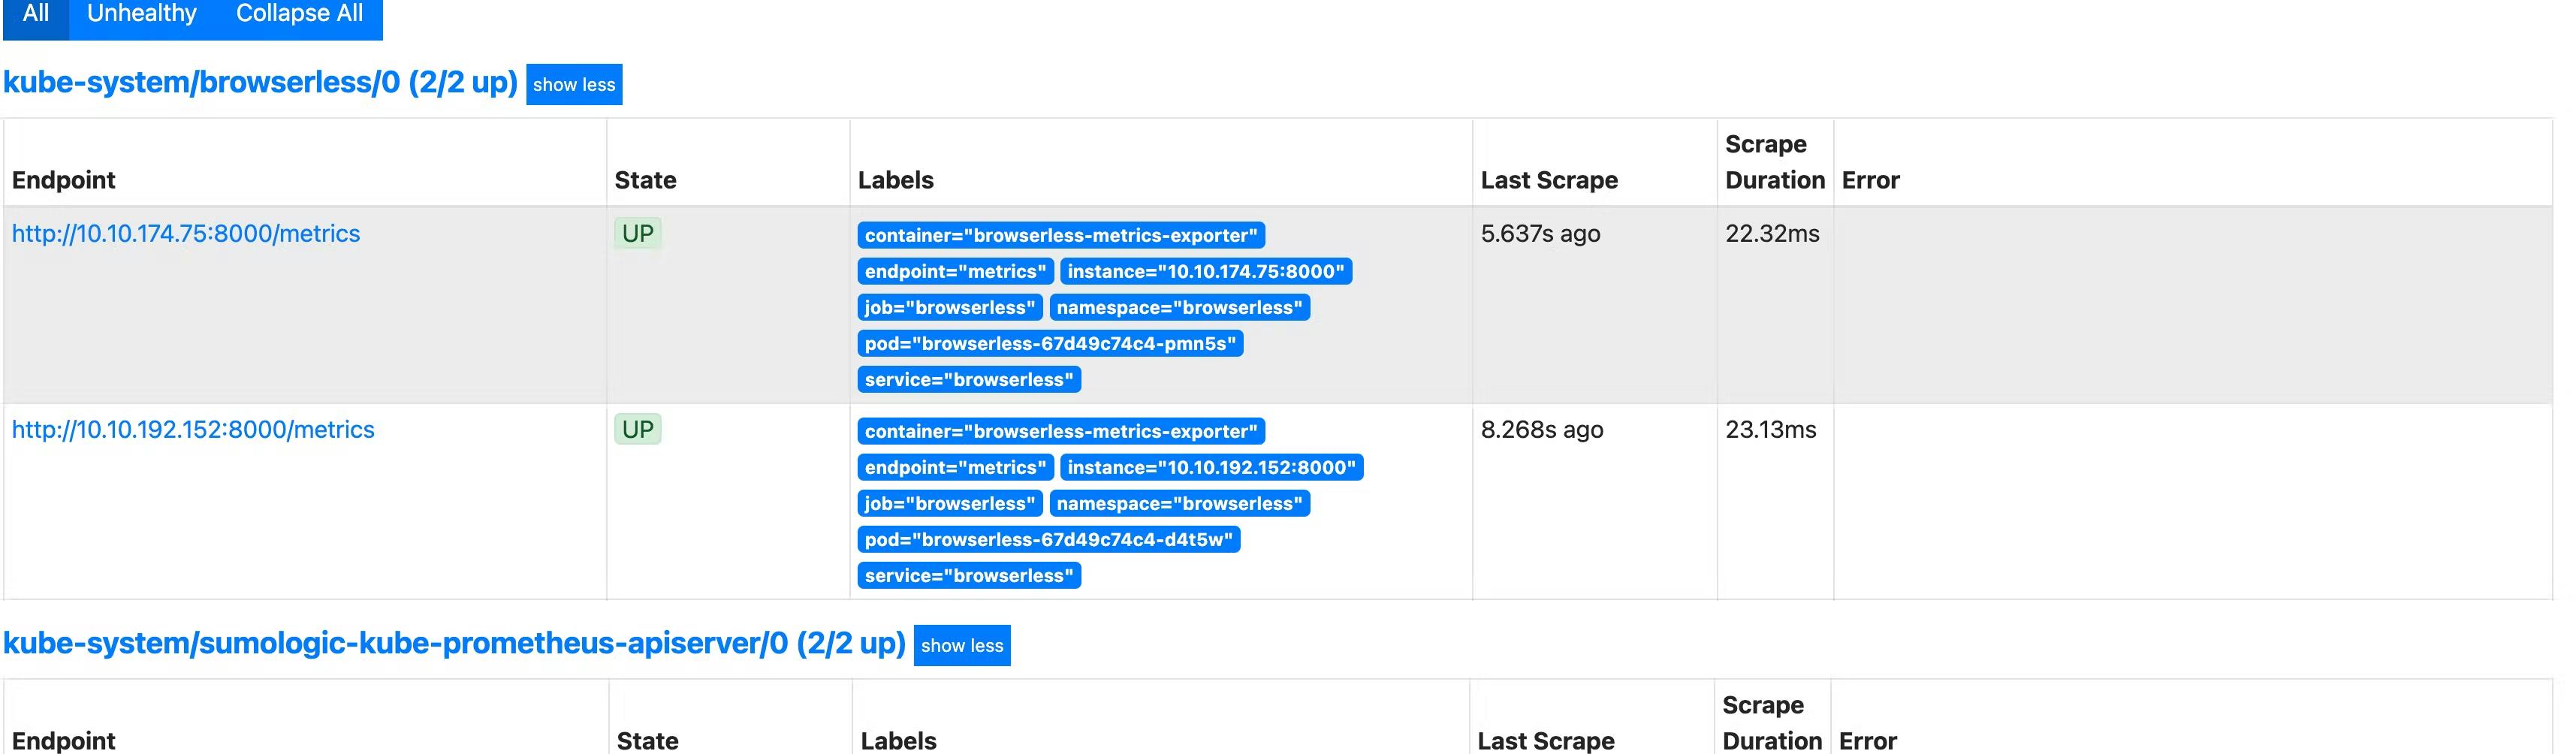
Testing if metrics are flowing from into Prometheus.
Service Monitor
See if the additional service monitor is created or not:
You should ideally get something like this and browserless is the service monitor we have created. If not then check the kube-prometheus-stack
Ports and Endpoints
You need to specify correct ports at three locations.
When defining kube-prometheus-stack
In the browserless_template file
In the Service Monitor
Internal API
We port forward the prometheus ports
and going to localhost:9090 and see if we see the browserless internal api is live or not. Looking at the error message can be helpful. Normally the error is in the Prometheus format, correct endpoints and ports.
X86 Images
To run it on cloud pods I have to upload a docker image for Metrics-Exporter to ECR. The ECR already has an image of Browserless chrome to run Browserless on pods
Its annoying that if you make a docker image on M1 mac, your image will be arm64 image. But the cloud is running x86 so there will be an issue. I had to ask Ryan, my internhost, upload images from his intel mac that runs x86. Alternatively, I made changes to the circle CI code that makes and uploads my ECR image directly. Circle CI runs whenever you push to github and runs some tests. So now it makes an image of the exporter and uploads it to EcR as well. Instructions to push to ECR is on AWS/ECR console where they give you push instructions.
Format
Check if the metrics are in correct prometheus format. Format is “browserless_{metric name} {value}”
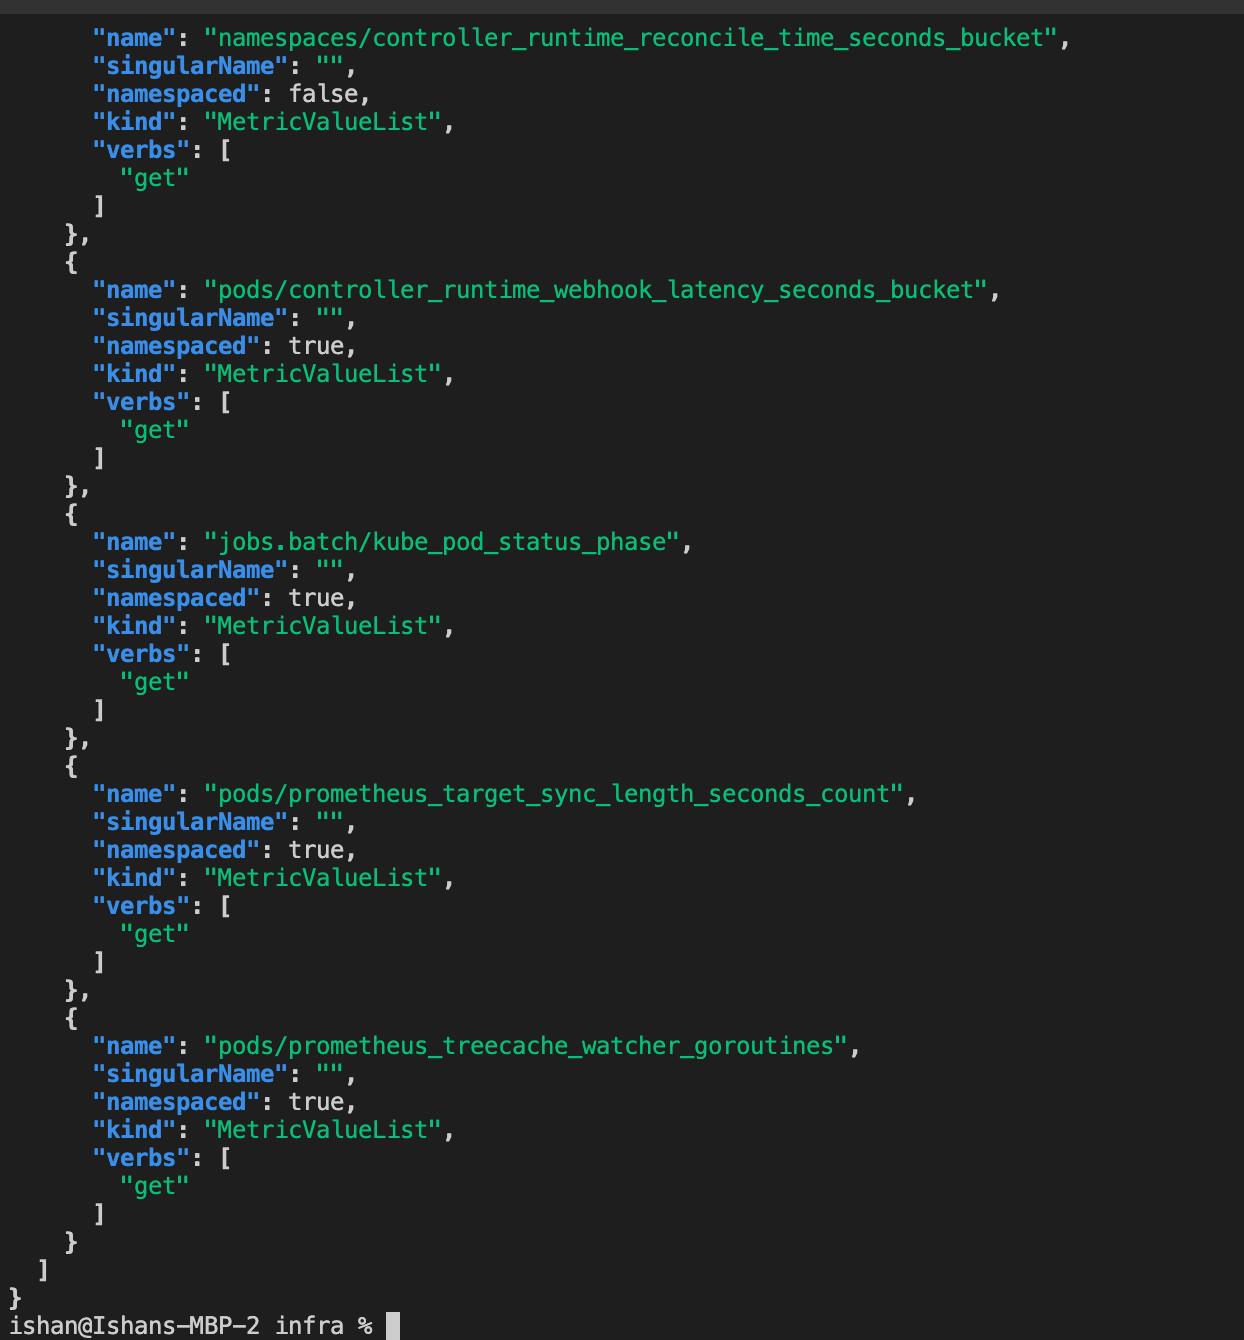
Testing if metric are flowing from Prometheus to Kubernetes
Custom metrics API
This should list the custom.metrics.api as available, like this.
This would he deployed by helm however it takes 2-3 minutes for the API to get started. Also, if you helm install/upgrade charts a lot, things might get a bit jumbled so it would beneficial to helm uninstall and deploy. Interns do not have access to uninstall charts so one can ask appropriate person with permissions.
Metric URLs
There are 2 URLs that you can check and see if you are getting metrics correctly.
This should ideally give you all the metrics that being scraped by prometheus.
This is give specific metrics and their values like this
Troubleshooting with logs
Prometheus Adapter and HPA info
You can see if the prometheus adapter pods are being created and not crashing. Checking individual pod logs can be too excessive and won’t help a lot.
You can check the what the HPA is doing — ideally should look like this
If not reading the message is useful. It will be mostly because the metrics are’t flowing in correctly to Kubernetes.
Want to print your doc? This is not the way.
Try clicking the ⋯ next to your doc name or using a keyboard shortcut (