JavaScript required
We’re sorry, but Coda doesn’t work properly without JavaScript enabled.
Skip to content
Gallery
Visualizations gallery
Gallery
Work log
Key resources
Visualizations DB
More
Share
Explore
Visualizations DB
Visualization
Tags
Chart
Packages
Notes
Visualization
Tags
Chart
Packages
Notes
1
Bullet chart
KPIs
Indicators
Python
Plotly:
https://plot.ly/python/bullet-charts/
R
Plotly:
https://plot.ly/r/bullet-charts/
https://datavizcatalogue.com/methods/bullet_graph.html
2
OHLC chart
Stockmarket
Time series
OHLC: "Open, high, low, and close"
https://datavizcatalogue.com/methods/OHLC_chart.html
3
Candlestick chart
Time series
Plotly:
https://plot.ly/python/candlestick-charts/
Introduction at the
The Data Visualisation Catalogue
:
https://datavizcatalogue.com/methods/candlestick_chart.html
4
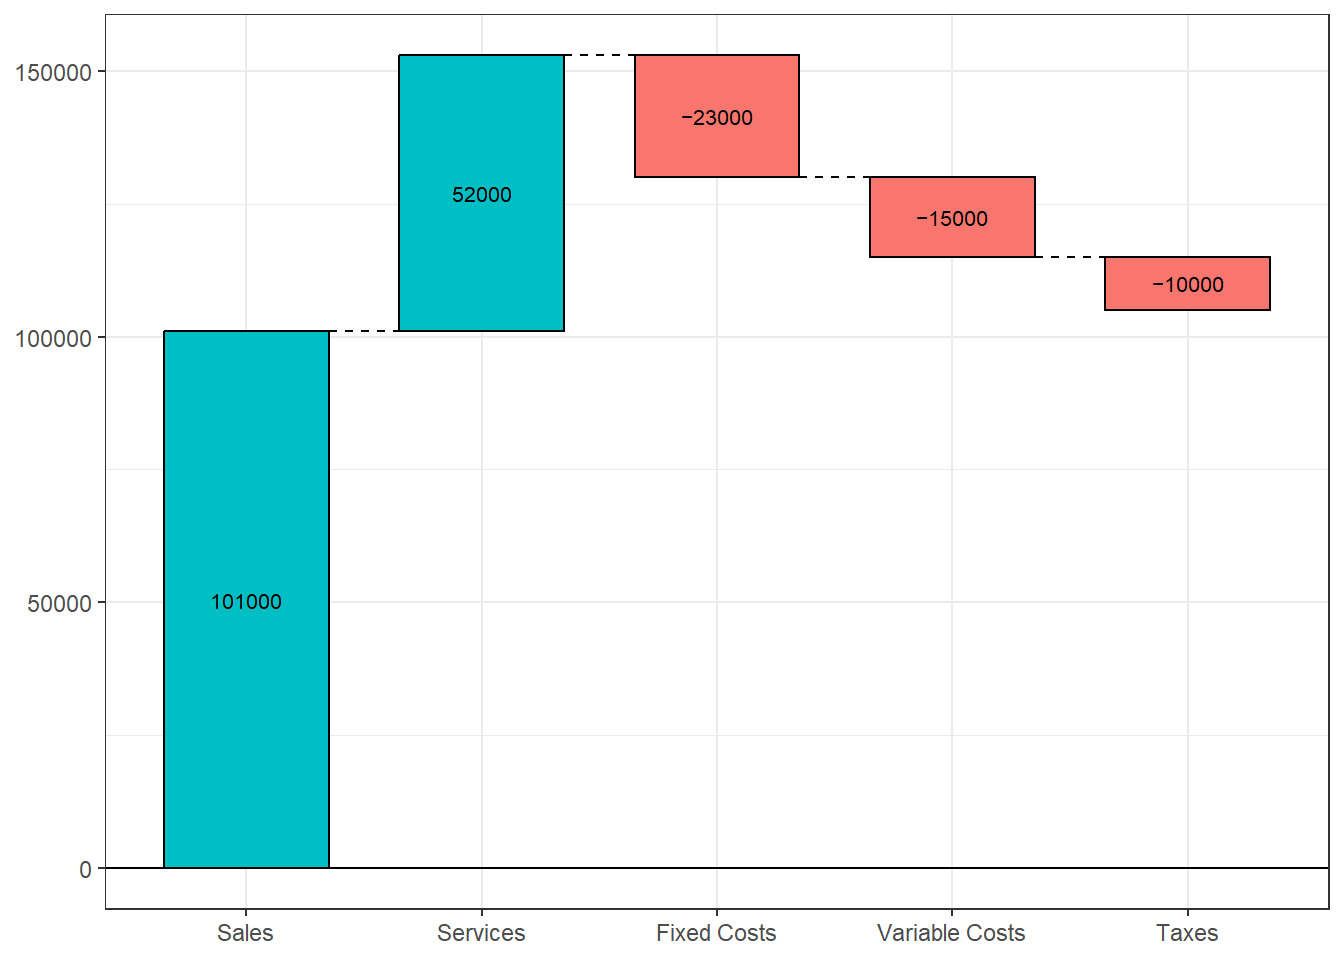
Waterfall chart
Cumulation
Python
Plotly:
https://plot.ly/python/waterfall-charts/
R
Plotly:
https://plot.ly/r/funnel-charts/
Using
ggplot2
and
waterfalls
:
https://rkabacoff.github.io/datavis/Other.html#waterfall-charts
5
Funnel chart
Subset
Plotly:
https://plot.ly/python/funnel-charts/
6
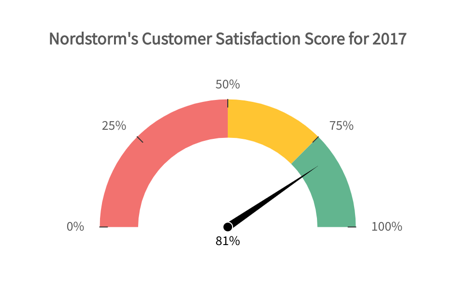
Gauge/indicator chart
Indicators
KPIs
Python
Plotly:
https://plot.ly/python/gauge-charts/
,
https://plot.ly/python/indicator/
R
Plotly:
https://plot.ly/r/gauge-charts/
7
Sankey/Alluvial diagram
Python
Plotly:
https://plot.ly/python/sankey-diagram/
R
Ploty:
https://plot.ly/r/sankey-diagram/
ggalluvial
:
https://github.com/corybrunson/ggalluvial
alluvial
:
networkD3
:
https://www.r-graph-gallery.com/321-introduction-to-interactive-sankey-diagram-2.html
(interactive)
https://datavizcatalogue.com/methods/sankey_diagram.html
8
Parallel coordinate diagram
https://datavizcatalogue.com/methods/parallel_sets.html
There are no rows in this table
Want to print your doc?
This is not the way.
Try clicking the ⋯ next to your doc name or using a keyboard shortcut (
Ctrl
P
) instead.