Skip to content
 Document

Activity 2: Measuring and Graphing Speed
Guiding Question: How can you measure and graph the speed of a moving object?
Key Words: speed
Get Started:
There are no rows in this table
1. What factors can contribute to a car accident?
2. Read the introduction and Guiding Question to Activity 2, “Measuring and Graphing Speed,” in your Student Book.
3. Speed is often measured using devices such as a speedometer or radar gun. How do you think people measured speed before those devices were invented?
Do the Activity:
There are no rows in this table
1. Read Procedure Steps 1-9 in your Student Book.

2. Watch the LABsent video (found here: ), and record your data. Each time the video says to record, you may want to pause the video to give you ample time to complete your observations. Record your data in the data provided below.
Data:
Cart Speed
1
100
2
100
3
100
Average
There are no rows in this table
5. Look in Appendix G of your Student Book and read the definition for the crosscutting concept of scale, proportion, and quantity. How does this crosscutting concept help us investigate speed?
6. Answer Analysis Item 1.
Part B: Interpreting Motion Graphs
In Part A, you calculated the average speed of a cart during its trip on a track. But sometimes the speed of an object changes during a trip. For example, the driver of a car often changes the speed of the car because of traffic or road conditions. When the speed of an object changes over the course of a trip, a motion graph is useful because it shows the speed during all parts of the trip.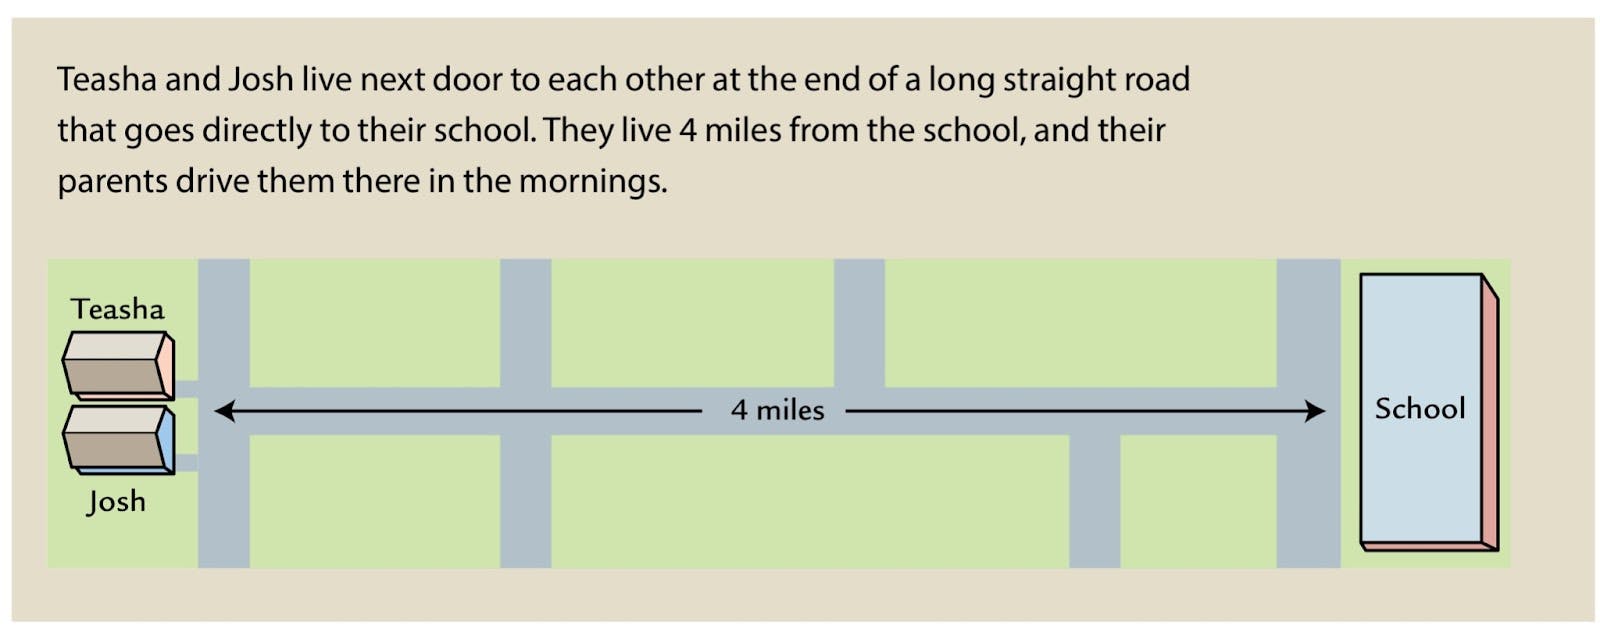
7. Look at the eight trip strips on Student Sheet 2.1, “Trip Strips,” which is attached to this document.
8. Read the trip strips. Each strip represents a piece of a story. Some of the strips describe Teasha’s trip to school. The others describe Josh’s trip.
9. Identify the strip that matches each segment of the two motion graphs shown on Student Sheet 2.2, “Teasha’s and Josh’s Trips to School,” which is attached to this packet.
10. Click and drag each trip strip onto the segment of the graph that it describes. Notice, the strips on Student Sheet 2.2 are the same as the ones on Student Sheet 2.1, however they have been colored and turned sideways to make it easier. The first strip has been placed on the appropriate segment for you.
11. Explain your choices in the space provided.
Analysis:
There are no rows in this table
1. What is a car’s speed in m/s if it travels…
a. 5 m in 0.1 s?
b. 5 m in 0.2 s?
c. 10 m in 0.2 s?
2. Identify a place on each motion graph where the following occurs:
a. The line is flat. What does it mean when the slope of the line is zero?
b. The slope of the line changes. What does a change in the slope of a motion graph indicate?
3. Which student—Teasha or Josh—started out faster? Explain how you know this.
4. How far into the trip did Josh turn around? Describe what the graph looks like at this point in the trip.
5. Look at the following motion graphs that indicate distance vs. time. Match the descriptions here to the correct graphs.

a. A car moving at a constant speed stops and then moves in the opposite direction at the same speed.
b. A car moving at a constant speed stops and then moves faster in the same direction.
c. A car moving at a constant speed changes to a higher constant speed.
d. A car moving at a constant speed changes to a lower constant speed.
STUDENT SHEET 2.1
TRIP STRIPS
A Car takes 4 minutes to return home (30 MPH).
B Car travels 4 miles in 8 minutes (30 MPH).
C Car stops for 6 minutes while picking up a friend.
D Car travels 3 miles toward school in 6 minutes.
E Josh, realizing he may have forgotten his homework, pulls over, and looks through his backpack for 1 minute.
F Teasha’s car gest caught in traffic and travels 1 mile in 8 minutes (7.5 MPH).
G Car travels 2 miles in 5 minutes.
H Car stops for 2 minutes.
There are no rows in this table
Want to print your doc?
This is not the way.
This is not the way.

Try clicking the ··· in the right corner or using a keyboard shortcut (
CtrlP
) instead.