Skip to content

Volume - tính cho những partner dành cho 5 kênh GHNOps - tính incentive cost HUB, ECOM, TRUCK và có thêm volume của TRUCKOps cost detail Transit - cost của TRUCKGHN - volume theo nhánh BIKE, HUB theo GHNTạo sheet Target được import từ sheet khác
Outsourcingoutsourcing_cost = stoppoint * 4600intencive_cost = Vlookup từ sheet Opstransit_cost = lấy sum(transit_cost) từ sheet Transit theo ngày tháng cần lấy và theo khu vực SGN, HANoutsourcing_cost = Vlookup từ sheet OutSourcingtransit_cost =Query từ sheet Summary tính tổng theo tháng và cả 2 khu vựcoutsourcing_cost =Query từ sheet Summary tính tổng theo tháng và cả 2 khu vực
Data màu xanh dương như GHN target vs actual, Ecom actual vs target, .... là những data đã được blend từ data sourceData xanh lá như Volume, Summary,... là những data source đã được xử lý và thêm metrics.
Chọn function đã addChọn event source: Time-drivenThời gian trigger: theo ngày, mỗi ngày từ 4am đến 5am, thông báo qua mail mỗi ngày.
Share
Explore
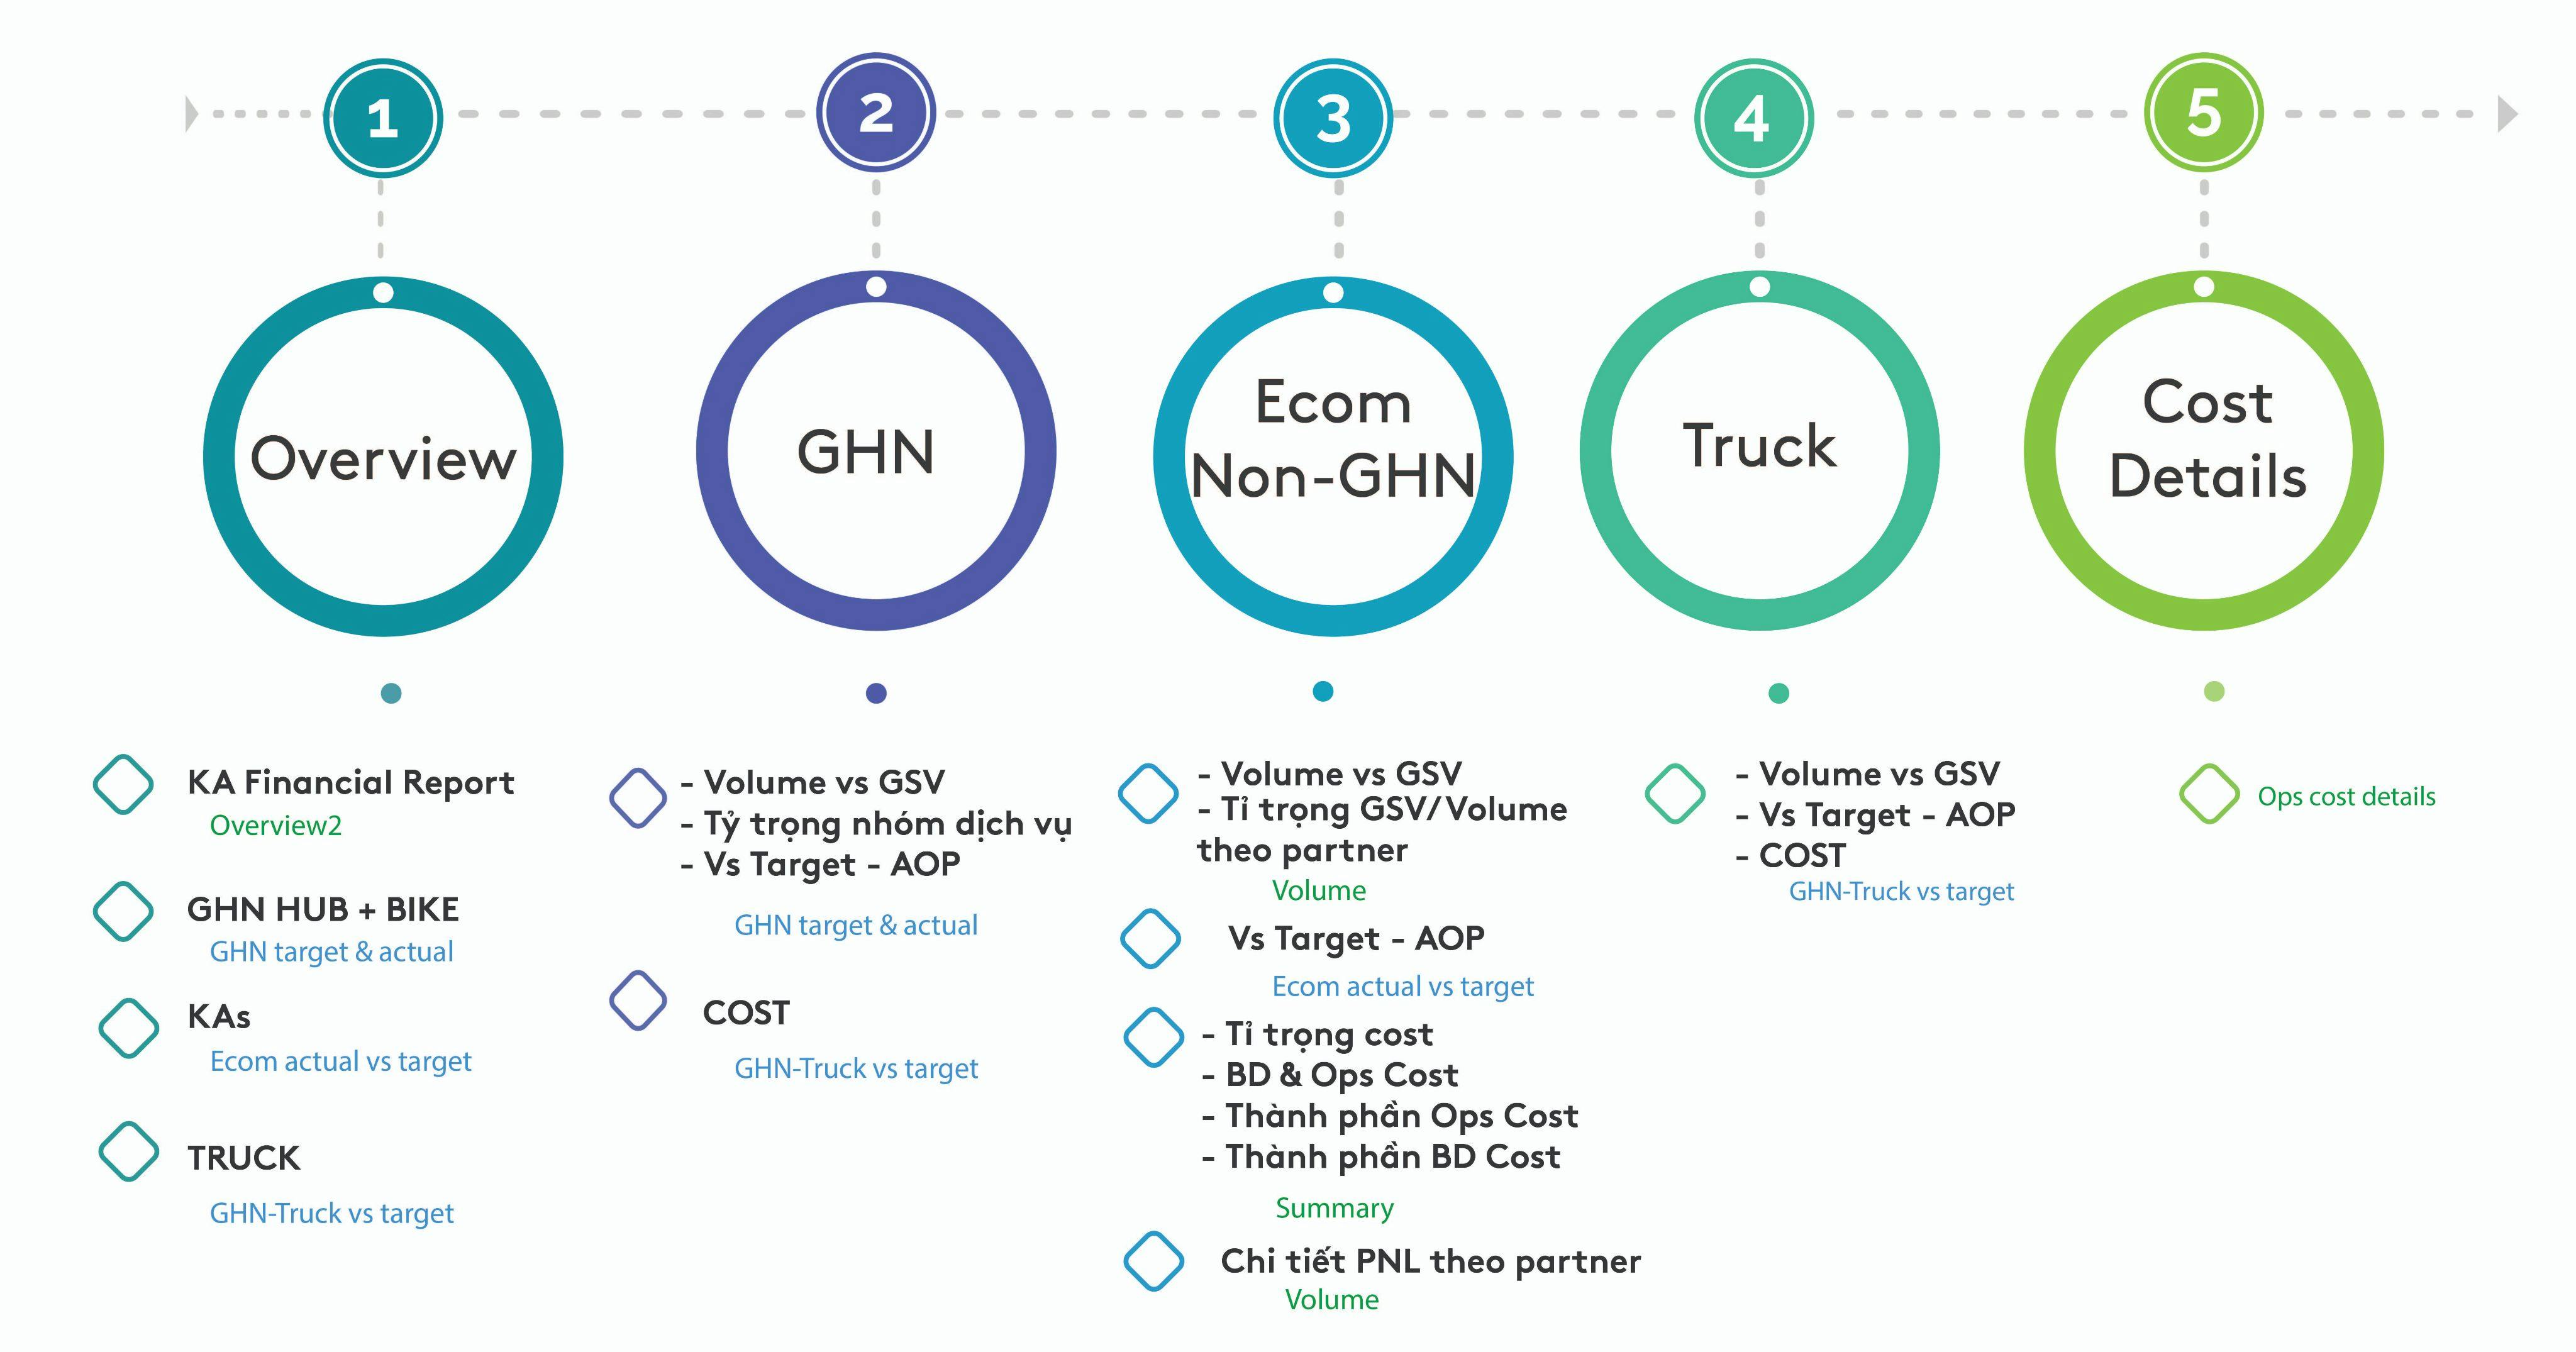
KA Dashboard
Overview
Tổng quan toàn bộ quy trình

1 - Push data
Sử dụng Google Apps Script đẩy data từ database sang Google Sheet với 5 Source tương ứng với 5 Sheet chính:
Volume - Ops - Ops cost detail - GHN - Transit
Những thuộc tính cần sử dụng trong mỗi Source:
Sector, day, week, month, partner, services, city_id, fulfill, stoppoint, partner_fee, driver_fee, revenue, diff_2pricing, discount.
period, city_id, services, refferal_cost, cross_services, non_cross_services, total_cost_supplier, stoppoint, cps, gsv, revenue, bd_cost, gp1, total_cost_gsv, cost_gsv_pct.
period, city_id, category, services, cost.
period, city_id, sector, pickup, transit_cost.
period, city, cate, requested, fulfill, completed, gsv, revenue
day, city, service, stoppoints, ops_cost, bd_cost, gsv, cost_gsv, internal_target_gsv.
2 - Extracting & transforming data
Google Sheet
Từ 5 sheet chính, tạo thành những sheet khác có data phù hợp cho từng report.

Note
2. Summary
3. WH_stp
Data Studio
Thêm tất cả data đã xử lý từ Google Sheet vào DataStudio

Setup metrics cho từng Data source

Công thức tính cho từng metrics được thêm vào

Blend data
Từ bộ data đã được xử lý tạo thành những Data source có data cần cho report

3 - Uploading data & completing report
Tổng quan về nội dung report
Note
4 - Trigger
Set up trigger chạy tự động các Function trên Google Apps Script


Nếu có function nào auto trigger không thành công:
Chọn function và run

Want to print your doc?
This is not the way.
This is not the way.

Try clicking the ··· in the right corner or using a keyboard shortcut (
CtrlP
) instead.