Skip to content
02. Elements Of A Map

icon picker
Answers to textbook exercises

Prepared by: learnloophq@gmail.com
Last edited 43 days ago by Learn LoopHQ.

Chapter: 02. Elements Of A Map

EXERCISES

A. Choose the correct option.

Which of these is not a basic element of a map?
(iv) A thread
Which of these is the value of the numerator of a representative fraction?
(i) 1
Which of these is the ratio of the distance between two places on a map to the actual distance between the same two places on the ground?
(i) Scale

B. Fill in the blanks.

North, South, East and West are also called the cardinal directions.
Representative Fraction (RF) is a fraction in which the numerator expresses the distance on the map and the denominator represents the actual distance on the ground.
A legend or key explains the colours, signs, and symbols used in the map.
Latitudes are the horizontal east-west lines.
Longitudes are vertical north-south lines that run from pole to pole.

C. State whether the following are true or false. Rewrite the false statements correctly.

Red colour is used to denote vegetations on maps.
False. Dark green colour is used to denote natural vegetation on maps.
There are six intermediate directions.
False. There are four intermediate directions (North-East, South-East, South-West, North-West), and when subdivided further, there are eight more, making sixteen total compass points for greater accuracy.
Latitudes are vertical north-south lines that run from pole to pole.
False. Latitudes are horizontal east-west lines. Longitudes are vertical north-south lines that run from pole to pole.

D. Explain the differences between each of the following pairs.

Cardinal and intermediate directions
Cardinal directions are the four main directions: North, South, East, and West.
Intermediate directions are the directions that lie between the cardinal directions, namely North-East, South-East, South-West, and North-West.
Latitude and Longitude
Latitudes are horizontal east-west lines that measure the angular distance north or south of the Equator. They are parallel to each other and their length decreases towards the poles.
Longitudes are vertical north-south lines that measure the angular distance east or west of the Prime Meridian. They all run from pole to pole, are semicircles, and are of the same length.

E. Answer the following questions in brief.

What are the cardinal directions?
The cardinal directions are the four principal directions: North, South, East, and West.
Which three ways are used to represent the scale of a map?
The three ways to represent the scale of a map are: Verbal or statement scale, Graphical or linear scale, and Representative fraction (RF).
What is a legend or key?
A legend or key is an essential feature of a map that explains the meaning of the colours, signs, and symbols used within the map.
What are conventional signs and symbols?
Conventional signs and symbols are a variety of signs and symbols used on maps that are internationally recognized and agreed upon to represent natural and man-made features.
Name the features that are shown in blue, green and brown colours on a map.
Blue: Perennial water bodies (e.g., rivers, lakes, oceans).
Green: Natural vegetation (e.g., forests, grasslands), and light green for lowlands or plains.
Brown: Hills, mountains, and plateaux.

F. Answer the following questions.

What are the five different elements of a map? Explain them briefly.
The five basic elements of a map are:
Title: Informs us about the topic or what the map shows.
Direction: Helps to find directions on the map, usually indicated by a North arrow or by assuming the top is North.
Scale: Helps in calculating the actual distance between two places on the ground based on their distance on the map.
Legend or Key: Explains the meaning of the signs, symbols, and colours used in the map.
Grid System: The network of horizontal (latitudes) and vertical (longitudes) lines drawn on a map to help locate places.
Describe any two ways of representing a map scale.
Verbal or Statement Scale: This scale is stated in words, directly telling the reader what a unit on the map represents on the ground. For example, “1 cm = 5 km” means 1 centimeter on the map equals 5 kilometers on the ground.
Graphical or Linear Scale: This scale consists of a straight line drawn on the map, which is divided into segments representing specific distances on the Earth’s surface. It allows for direct measurement of distances on the map against the scale.
(Optional third for completeness): Representative Fraction (RF): This is a ratio or fraction where the numerator (always 1) represents the distance on the map and the denominator represents the actual distance on the ground, with both units being the same (e.g., 1:50,000).
Why is the key or legend an important element of a map?
The key or legend is an important element of a map because it acts as a guide, explaining the meaning of all the colours, signs, and symbols used on the map. Without it, a map would be difficult to understand, as the symbols and colours would have no clear meaning, making it impossible to interpret the information being conveyed about geographical features or other data.
Explain why colours are used in maps.
Colours are used in maps for several important reasons:
They make maps visually attractive and easier to read.
They help in quickly understanding and interpreting different features.
On physical maps, colours are conventionally used to represent specific features or elevation/depth ranges (e.g., blue for water, green for lowlands/vegetation, brown for highlands). This standardisation allows for universal understanding of the map’s content.
What is the grid system? Why is it important?
The grid system is a network of horizontal (latitudes) and vertical (longitudes) lines drawn on a map or globe.
It is important because it provides a precise framework for locating places on the Earth’s surface. By knowing the latitude and longitude coordinates of a place, one can pinpoint its exact position on a map, which is crucial for navigation, geographical studies, and various other applications.

G. Map work

Draw a linear scale to show two men standing 30 m apart. Use the scale 1 cm = 3 m.
Given scale: 1 cm = 3 m.
Total distance to represent: 30 m.
Length on map = Total distance / Scale value = 30 m / (3 m/cm) = 10 cm.
A linear scale would be drawn as a straight line 10 cm long. This line would be divided into segments. For example, it could be marked at 0, 3 m, 6 m, 9 m, … up to 30 m. Or, it could have primary divisions (e.g., every 15m) and secondary divisions (e.g., every 3m).
Convert the statement 1 cm = 100 km into an RF scale.
To convert to RF, both units must be the same.
1 km = 1000 meters
1 meter = 100 cm
So, 1 km = 1000 * 100 cm = 100,000 cm.
Therefore, 100 km = 100 * 100,000 cm = 10,000,000 cm.
RF = Distance on map / Distance on ground = 1 cm / 10,000,000 cm = 1:10,000,000 or 1/10,000,000.

H. Source-based questions.

Study the diagram alongside and fill in the blanks with appropriate directions: ​
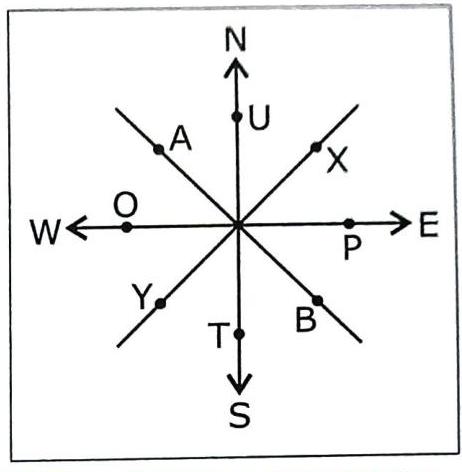
02._Elements_of_a_Map_img_8
T lies to the East of U.
P lies to the West of O.
O lies to the East of P.
Y lies to the South-East of X.
U lies to the West of T.

Gross-Curricular Conmet

Complete the table. One example is done for you. (C-1.2)
| Distance on the map | Distance on ground | Scale |
| :------------------ | :----------------- | :-------------------------- |
| Example: 5 cm | 25 km | 1 cm=5 km |
| 100 cm | 100 km | 1 cm=1 km |
| 2 cm | 60 km | 1 cm=30 km |
| 7000 cm | 49 km | 1 cm=7 m |
| 6 cm | 60,000 km | 1 cm=10,000 km |

Want to print your doc?
This is not the way.
Try clicking the ⋯ next to your doc name or using a keyboard shortcut (
CtrlP
) instead.