Skip to content
, a compendium of the most insightful articles ever written about network effects and network science
Why Network Effects Are ImportantHow Networks WorkProperties of NetworksBuilding and Maintaining Network EffectsRelated Concepts
 Bible
Bible
The Network Effects Bible
by James Currier & the NFX team

Network effects have been . Founders who deeply understand how they work will be better positioned to build category-defining companies.
This reference for Founders will be continually updated and includes a comprehensive collection of terms and insights related to network effects all in one place. It’s one of three definitive resources we’ve written about network effects, also including:
Roadmap
Part I.Why Network Effects Are Important
Network effects are mechanisms in a product and business where every new user makes the product/service/experience more valuable to every other user.
Network effects are important because they are the best form of defensibility, and thus value creation, in the digital world (the are brand, embedding, and scale).
As mentioned above, network effects account for the majority of value created in the technology industry in the past few decades, since many winner-take-all-companies in tech were powered by network effects.
Not all network effects are the same, however, and understanding the nuances is essential for building network effects of your own into your products. Different types of nfx are stronger or weaker than others, and they each work differently. To date we’ve identified . They’re listed as follows in order of strength:
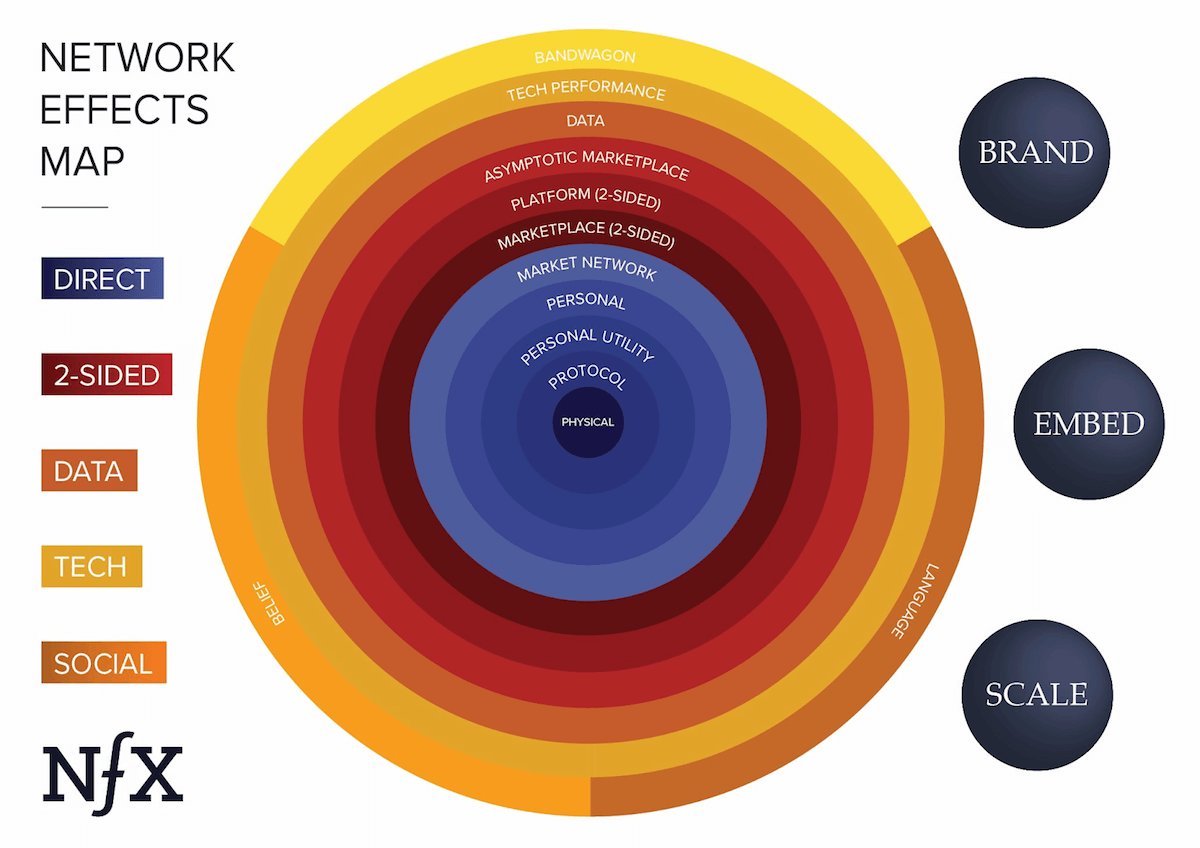
These network effects already touch, or will soon touch, every industry. Examples of how to apply the Network Effects Map can be found in this and in this .
Part II – How Networks Work
Broadly speaking, networks are interconnected systems of people or things. Networks can be found in almost every complex system — anything from power grids and roads to social media and human brains. Networks of all types, however, share several common characteristics. Understanding the underlying components of networks is useful for Founders looking to build network effect businesses of their own.
Nodes and Links
At a very basic level, networks are made up of nodes and links.
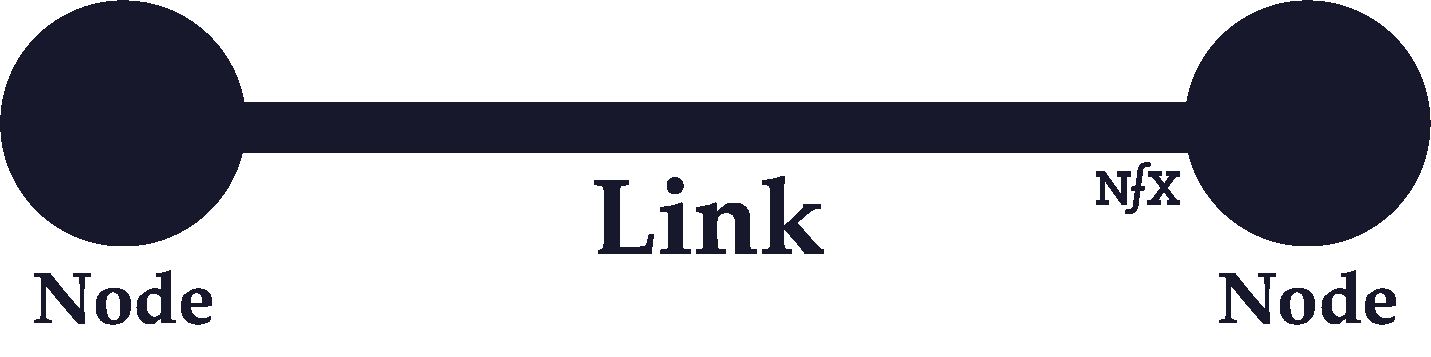
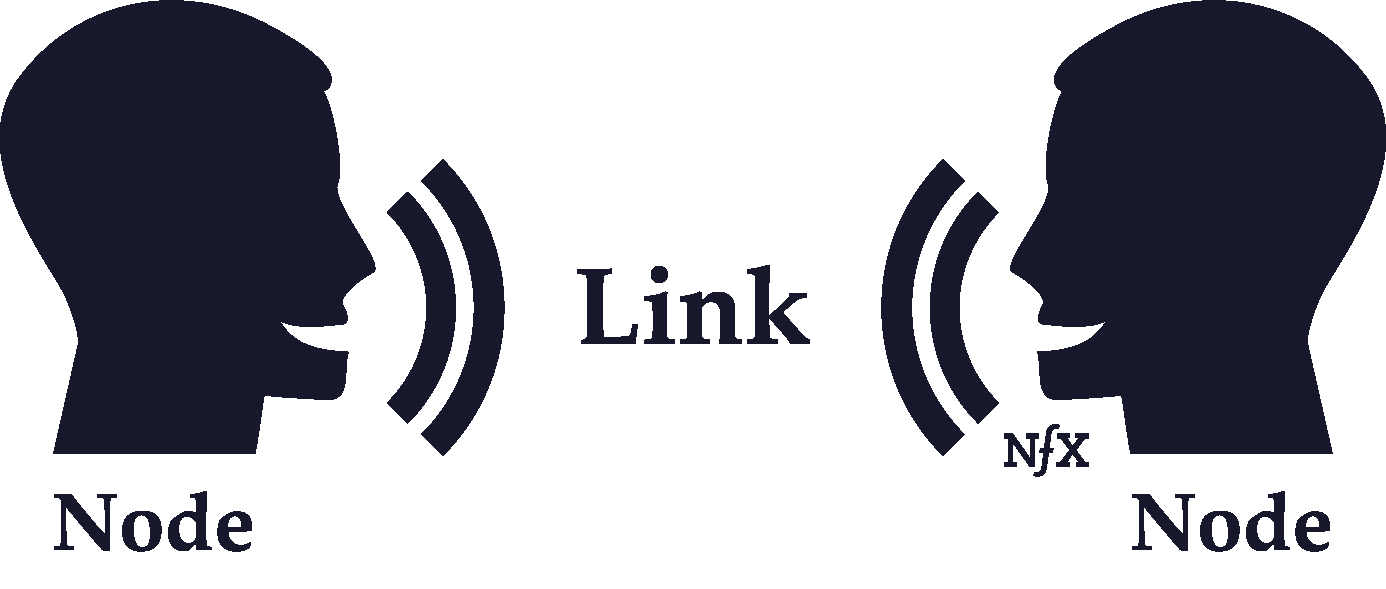
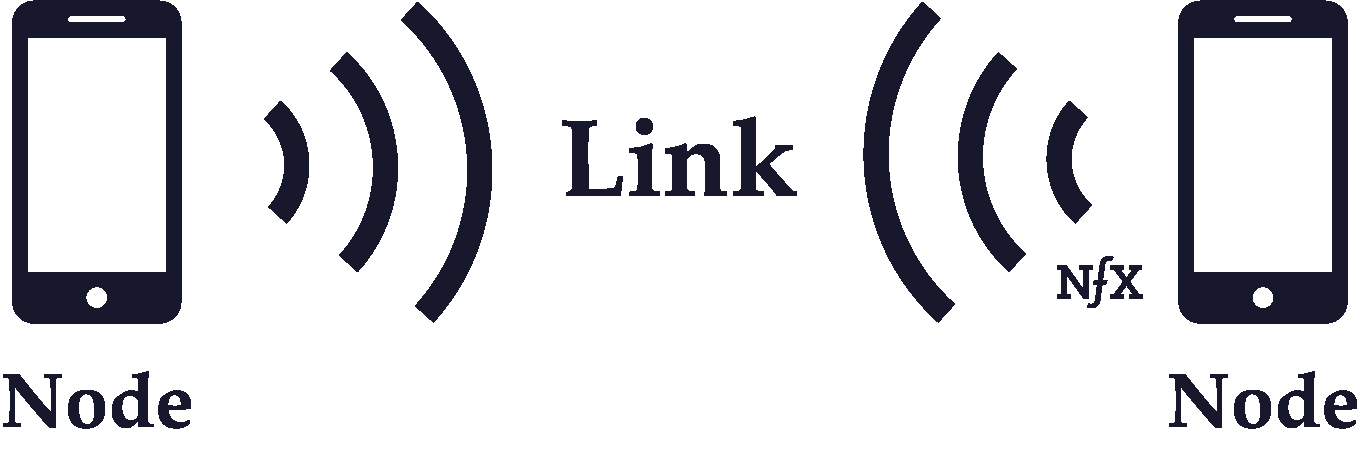
Nodes are the network participants: consumers, devices, customers, buyers, sellers, brokers, etc. Different types of nodes can have very different roles within the same network.
Nodes within the same network can differ in terms of their levels of impact, influence, power, and value. Central nodes are the nodes in a network with a high number of links and are often more valuable. Marginal nodes have relatively few links and typically have less value — although there can be exceptions if marginal nodes are connected to a few powerful nodes themselves. Accurately calculating the value of a node varies greatly from network to network.
Finally, network size can be measured by the total number of nodes in a network. The size of a network alone doesn’t determine value, because the amount of activity in a network can vary.
Links are the connections between nodes or groups of nodes in a network. Not all links between the nodes in a network are equal. Links can vary (see below) in terms of directionality.
Links vary in terms of strength, which is a function of the durability, closeness, and activity between two nodes. For instance, your Facebook Messenger link to your best friend is a lot stronger than your link to someone who you haven’t talked to since high school, but they both count as links in the Facebook Messenger network.
Network Density
The density of a network is determined by its ratio of links to nodes. The higher the ratio, the denser the network.
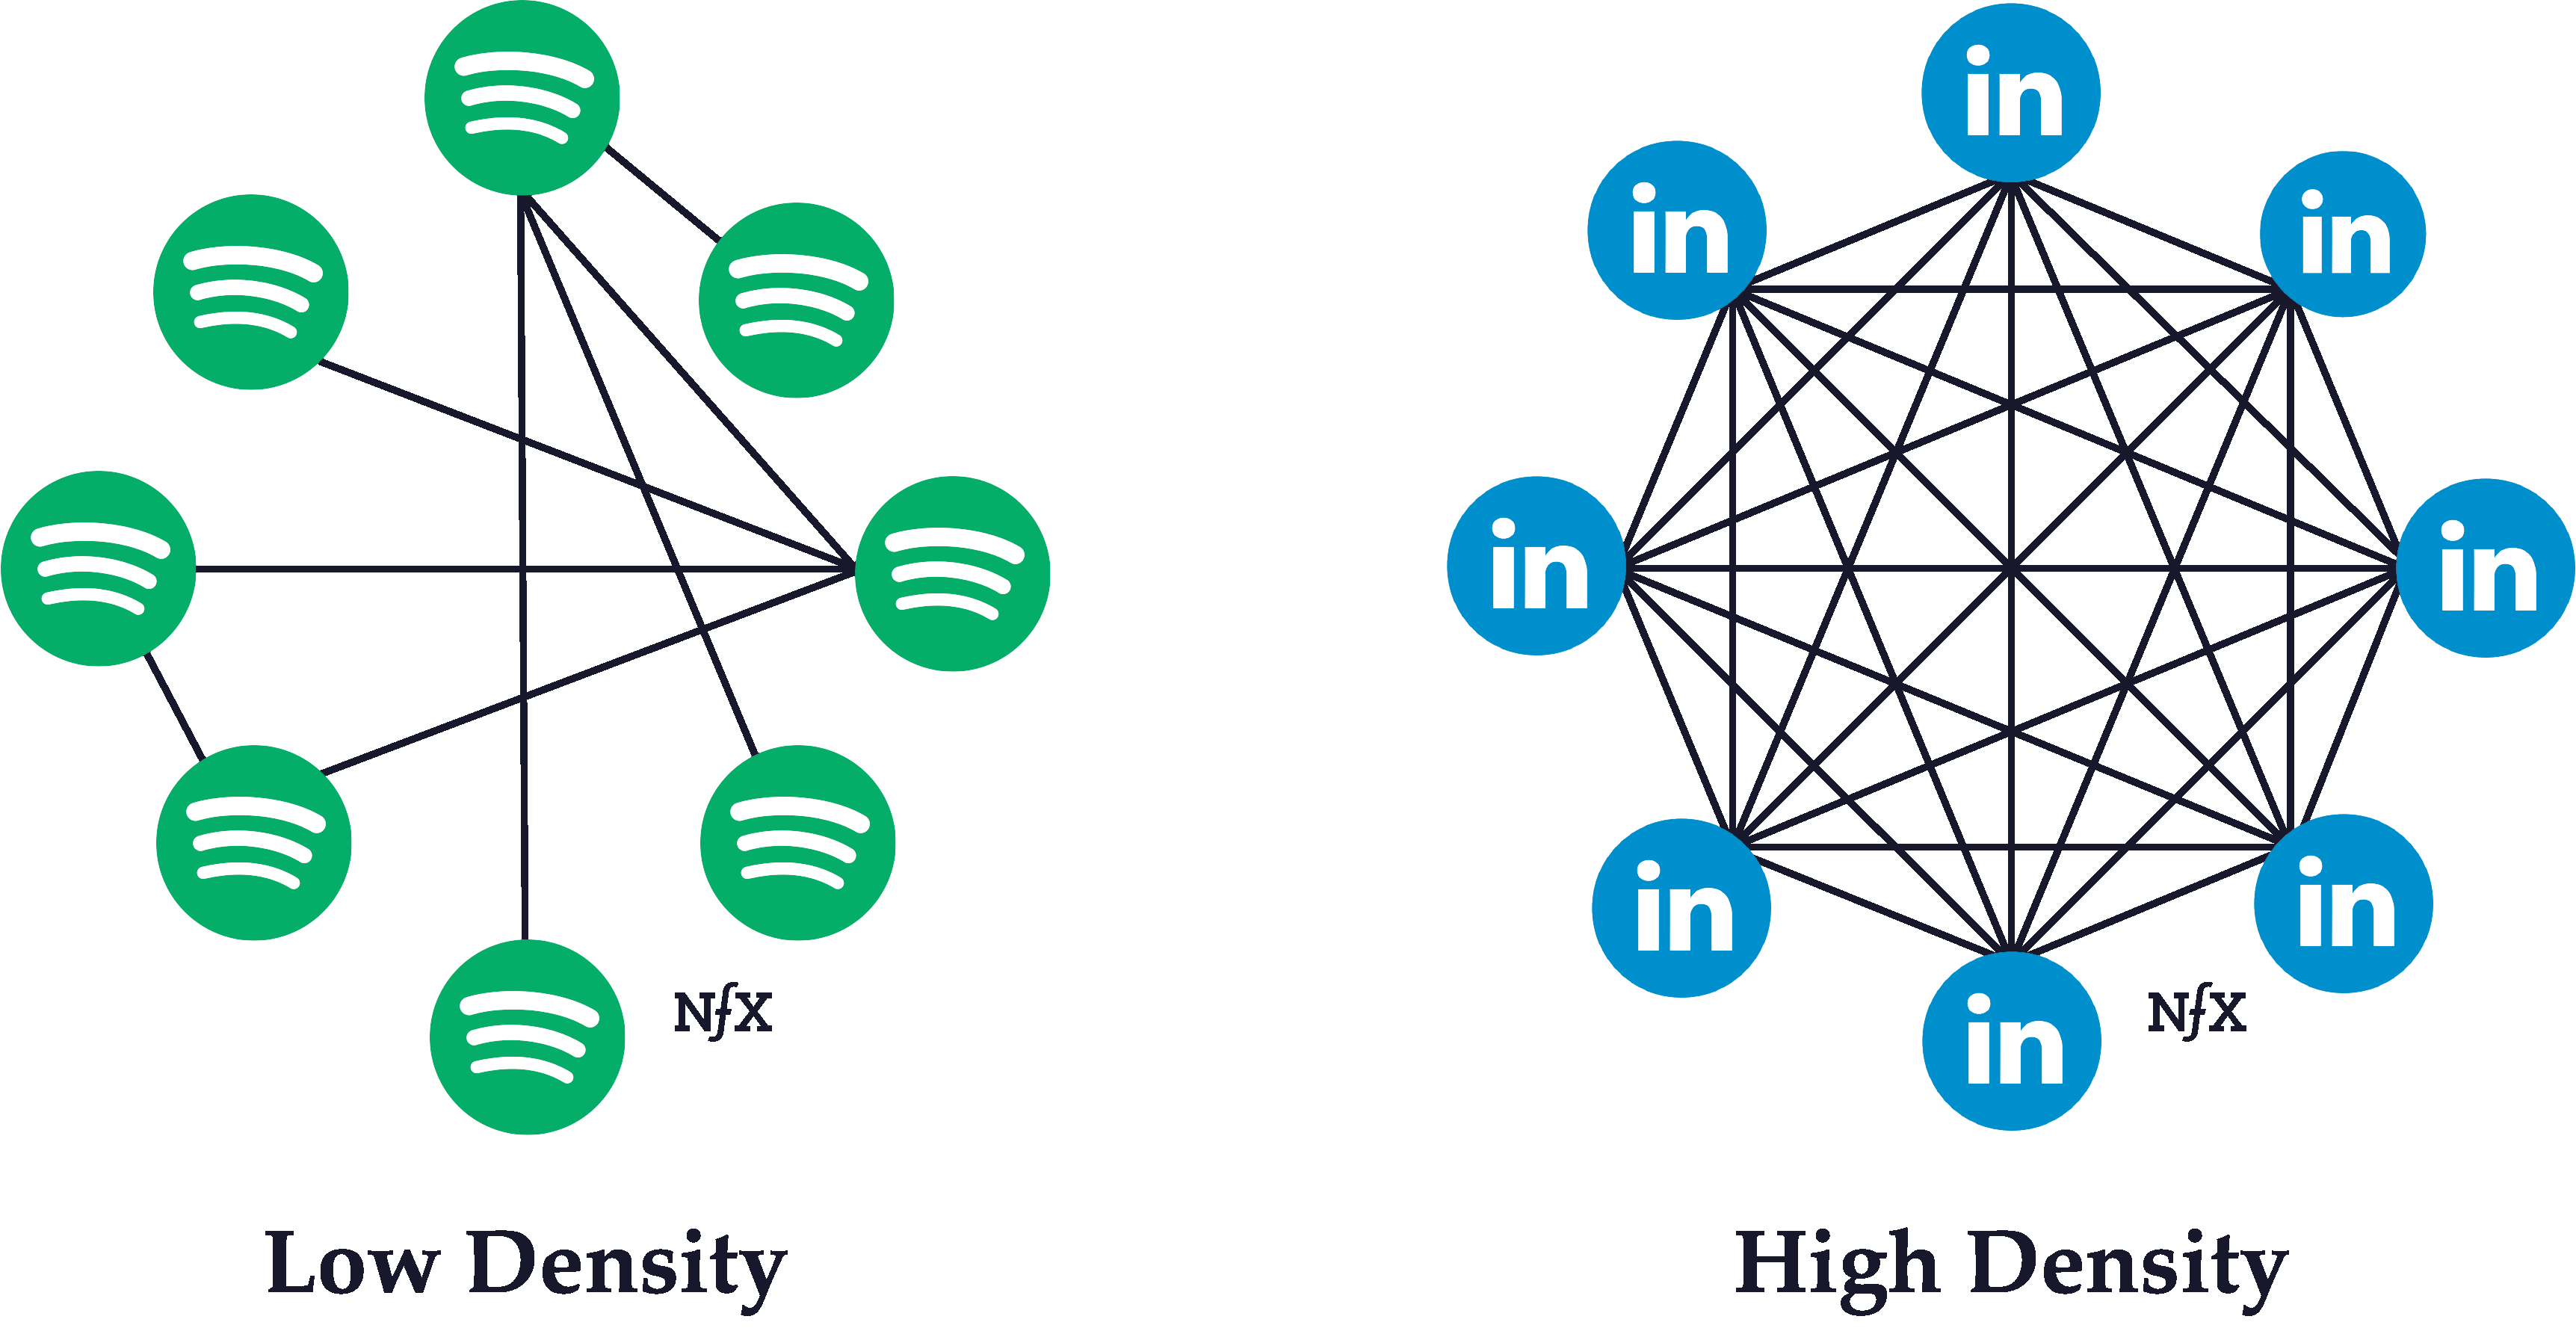
Typically, the higher the density of a network, the more powerful its network effects are. The interconnectivity of links serve to reinforce and strengthen the connections between other nodes. If you’re friends with someone, for instance, who is friends with all your other friends, the strength of your bond is likely to be stronger than it would be in isolation.
Density is typically distributed unevenly within a network. Certain areas within a network can have much higher density than other areas of a network (which is what leads to clustering, a phenomenon described in greater detail below).
In building products, it’s advisable to pay attention to how nodes form connections with each other so you can design your product to promote higher network density. Look for the “white-hot center” of your network — the densest, highest activity part —and focus the product features and language on activating other users to behave more like that group. Their activity will attract other nodes who will be inspired by the activity of the “white-hot” group, and it will radiate outward from there much faster than you might think.
Directionality
In graph theory, which is an aspect of network science, a link between nodes can be either directed or undirected.
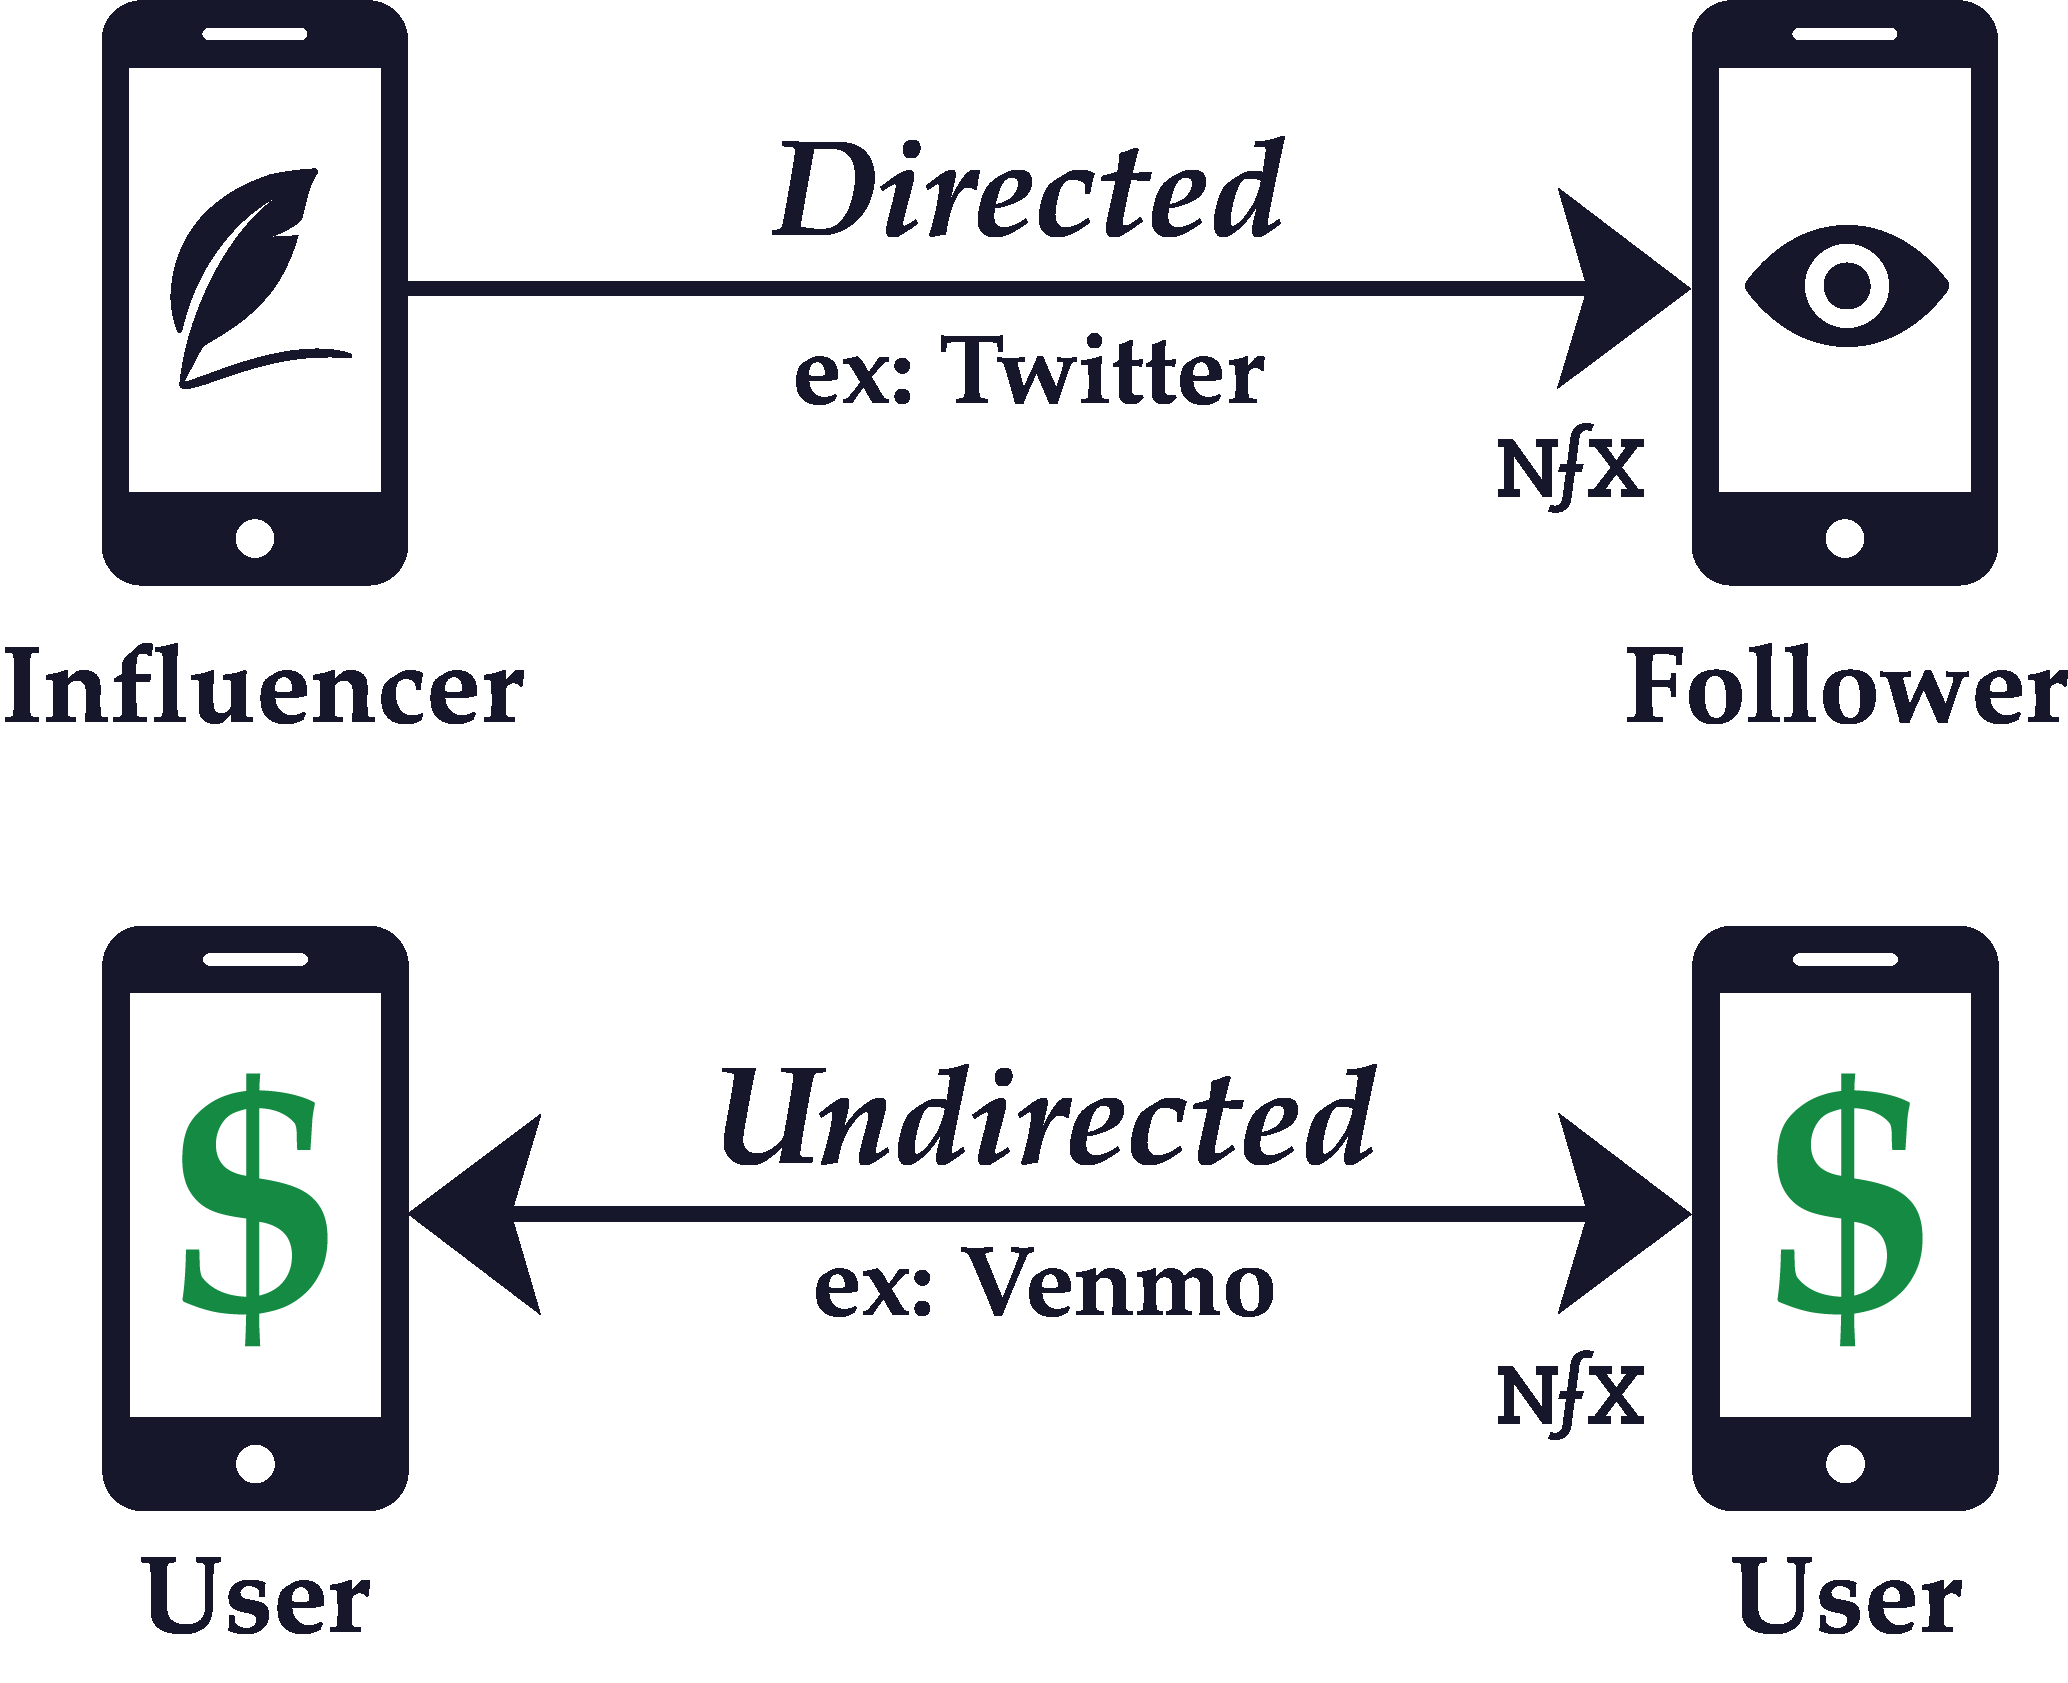
Whether a graph is directed or undirected depends on the nature of the connections between the nodes of a network. If the connections are directed, it means that one node points to the other in an unreciprocated fashion.
On a like Twitter, for example, well-known people like celebrities and politicians have huge followings which they don’t reciprocate. The flow of information is mostly one way — from the bigger, more central nodes to the smaller, more marginal nodes.
Contrast that with a like Facebook Messenger or WhatsApp, where connections are necessarily reciprocal. If you have a conversation with someone on Facebook Messenger, the flow of information and interaction is bidirectional. So Facebook Messenger and WhatsApp are examples of networks with undirected connections.
The direction of a link between nodes in a network is determined by which way, if any, the interaction between nodes in a network flows. That interaction can include the transfer of money, information, communication, and anything else that can pass between nodes as they interact.
A network that consists of directed links only is called a digraph, but true digraphs are rare. Usually, networks encompass a mixture of directed and undirected connections. Understanding the directionality of links in your network and mapping them visually leads to far better product design and prioritization of features.
One-to-One vs One-to-Many
Relationships between nodes in a network can be one-to-one, or they can be one-to-many.
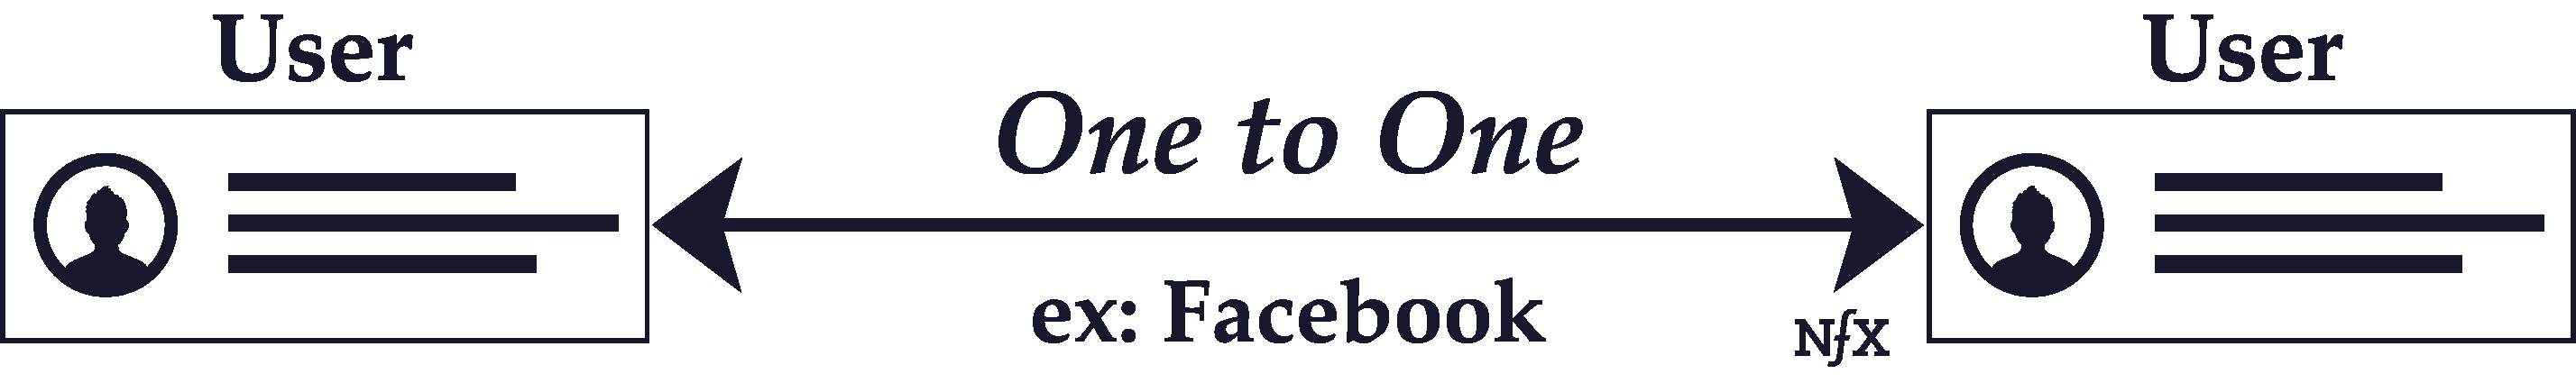

The key attribute of one-to-many connections is that they are directed links, where the flow of the interaction is unidirectional. One-to-one relationships, on the other hand, are usually functionally reciprocal. Therefore, they’re undirected. The interaction flows both ways.
In the example of Twitter discussed earlier, or other asymmetric-follow personal networks like Instagram or YouTube, there are central nodes with many followers (inbound directed connections), and there are marginal nodes without many followers. The marginal nodes in these examples are primarily observers, whereas the central nodes are content producers.
Central nodes with one-to-many relationships can broadcast to marginal nodes, whereas the interaction that flows back is usually small to non-existent (think of the relationship of a celebrity and their followers on Instagram or a TV network and their viewers).
Central nodes also can exist in one-to-one connection networks like Facebook (although they eventually ended up adding a one-to-many “follow” feature themselves), where some users have many friends and others very few. But the potential for disparity isn’t as vast as it is with networks that allow for one-to-many networks.
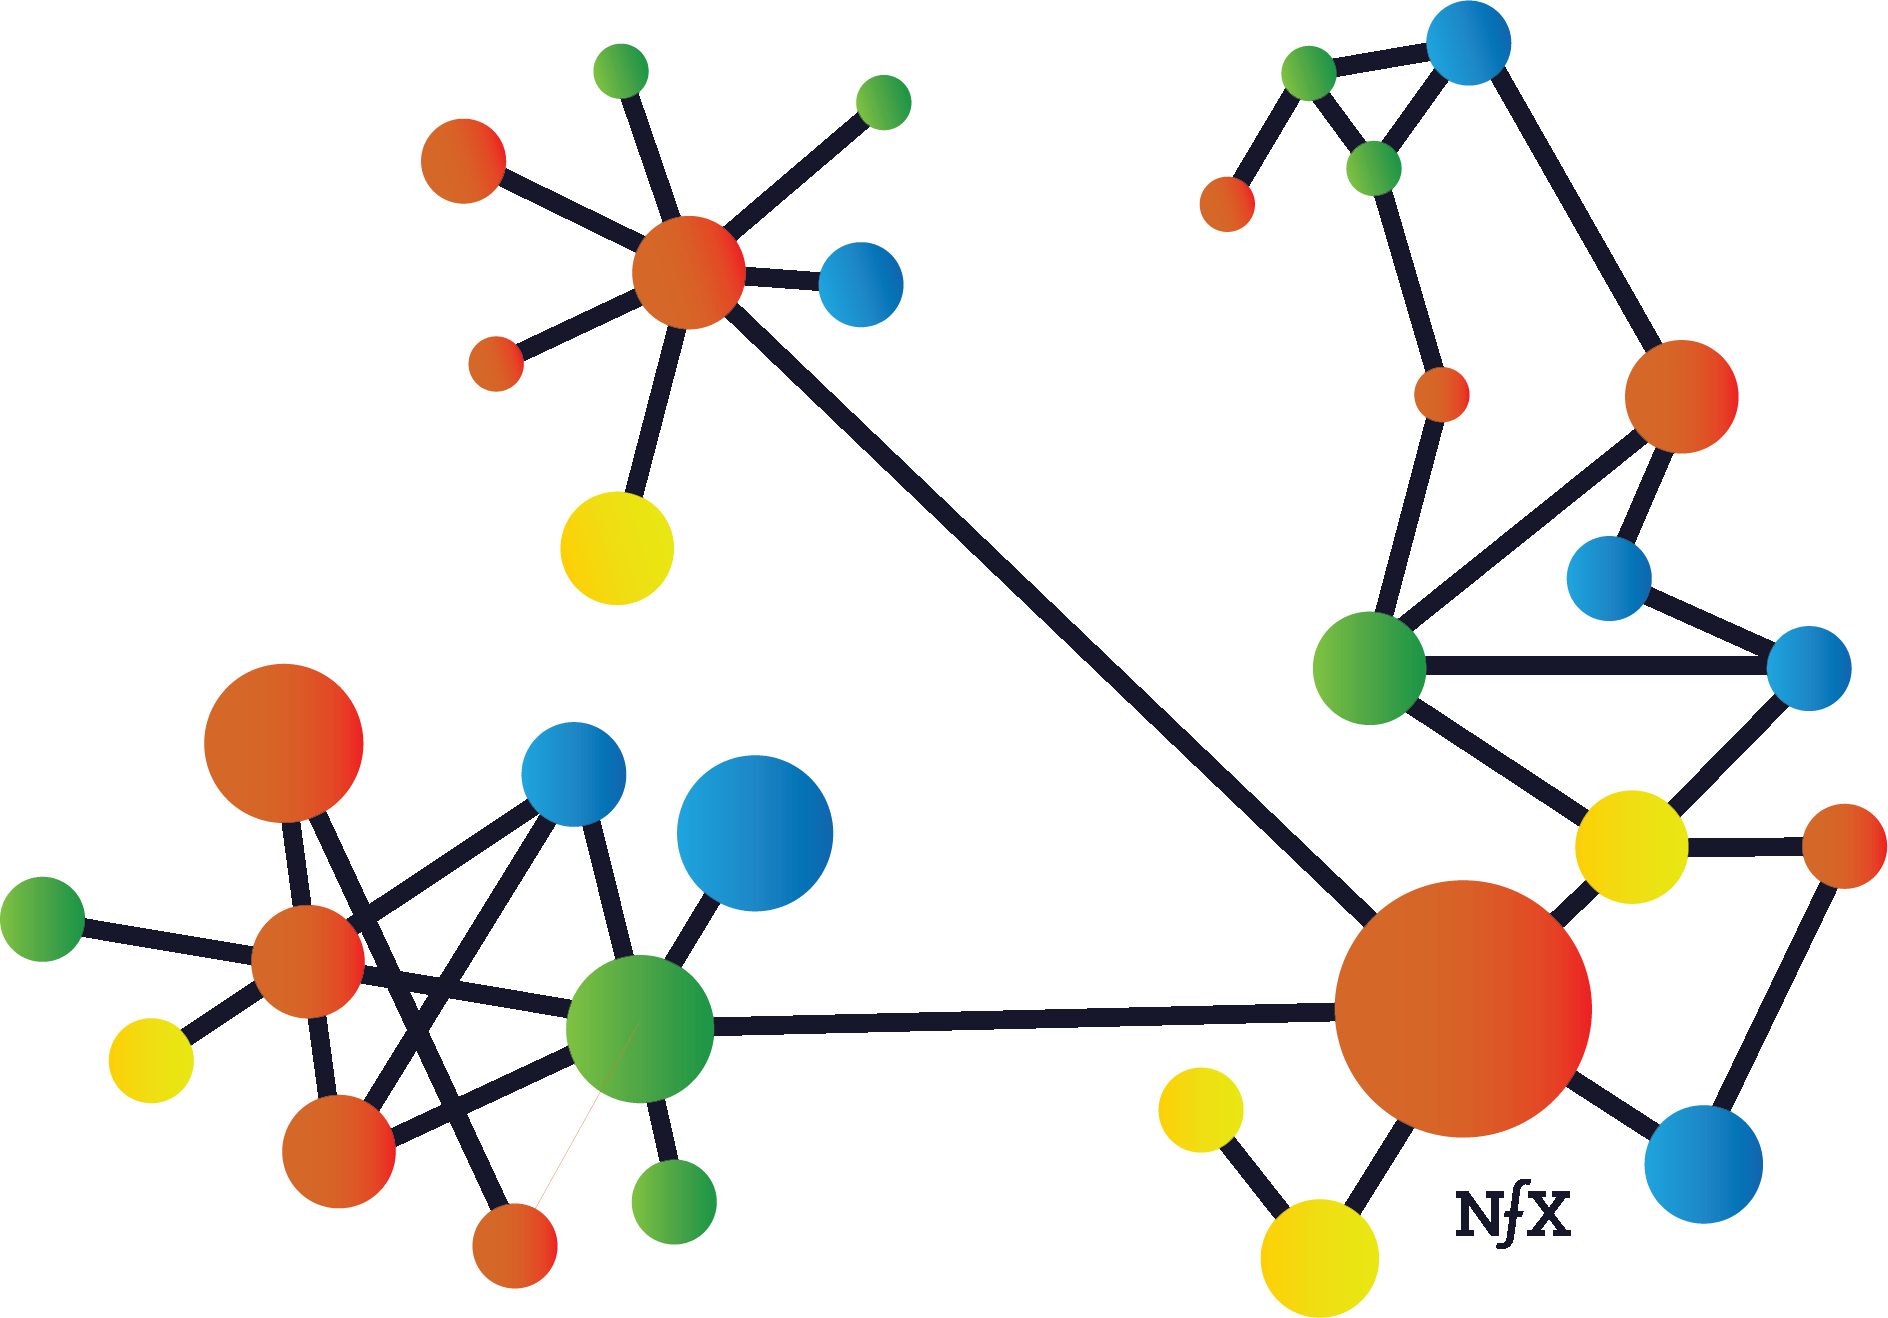
Clustering

Within real-world networks, nodes are unlikely to be dispersed evenly. They tend to cluster or form local groupings that are more tightly knit than the network at large. When two clusters are connected by a solitary link, but are otherwise unconnected and isolated from each other, that link is called a bridge.
Clustering can be witnessed in online personal utility networks like Slack or Facebook Messenger, where people form subgroupings that are more active than the broader network. You can probably see examples if you consider your own private use of those services. A similar clustering phenomenon also can be seen publicly on Twitter and YouTube among popular members of those networks.
The networks with higher degrees of clustering, measured by a “clustering coefficient”, can have the very powerful network effects as described by Reed’s Law (more on this below), which posits exponential increases in value as a network grows. A network with a high clustering coefficient will increase exponentially in value while it grows, while a network with low clustering will increase in value at a slower rate. There are tactics for increasing the clustering coefficient in your network, although not all networks are equally susceptible to forming clusters.
Critical Mass
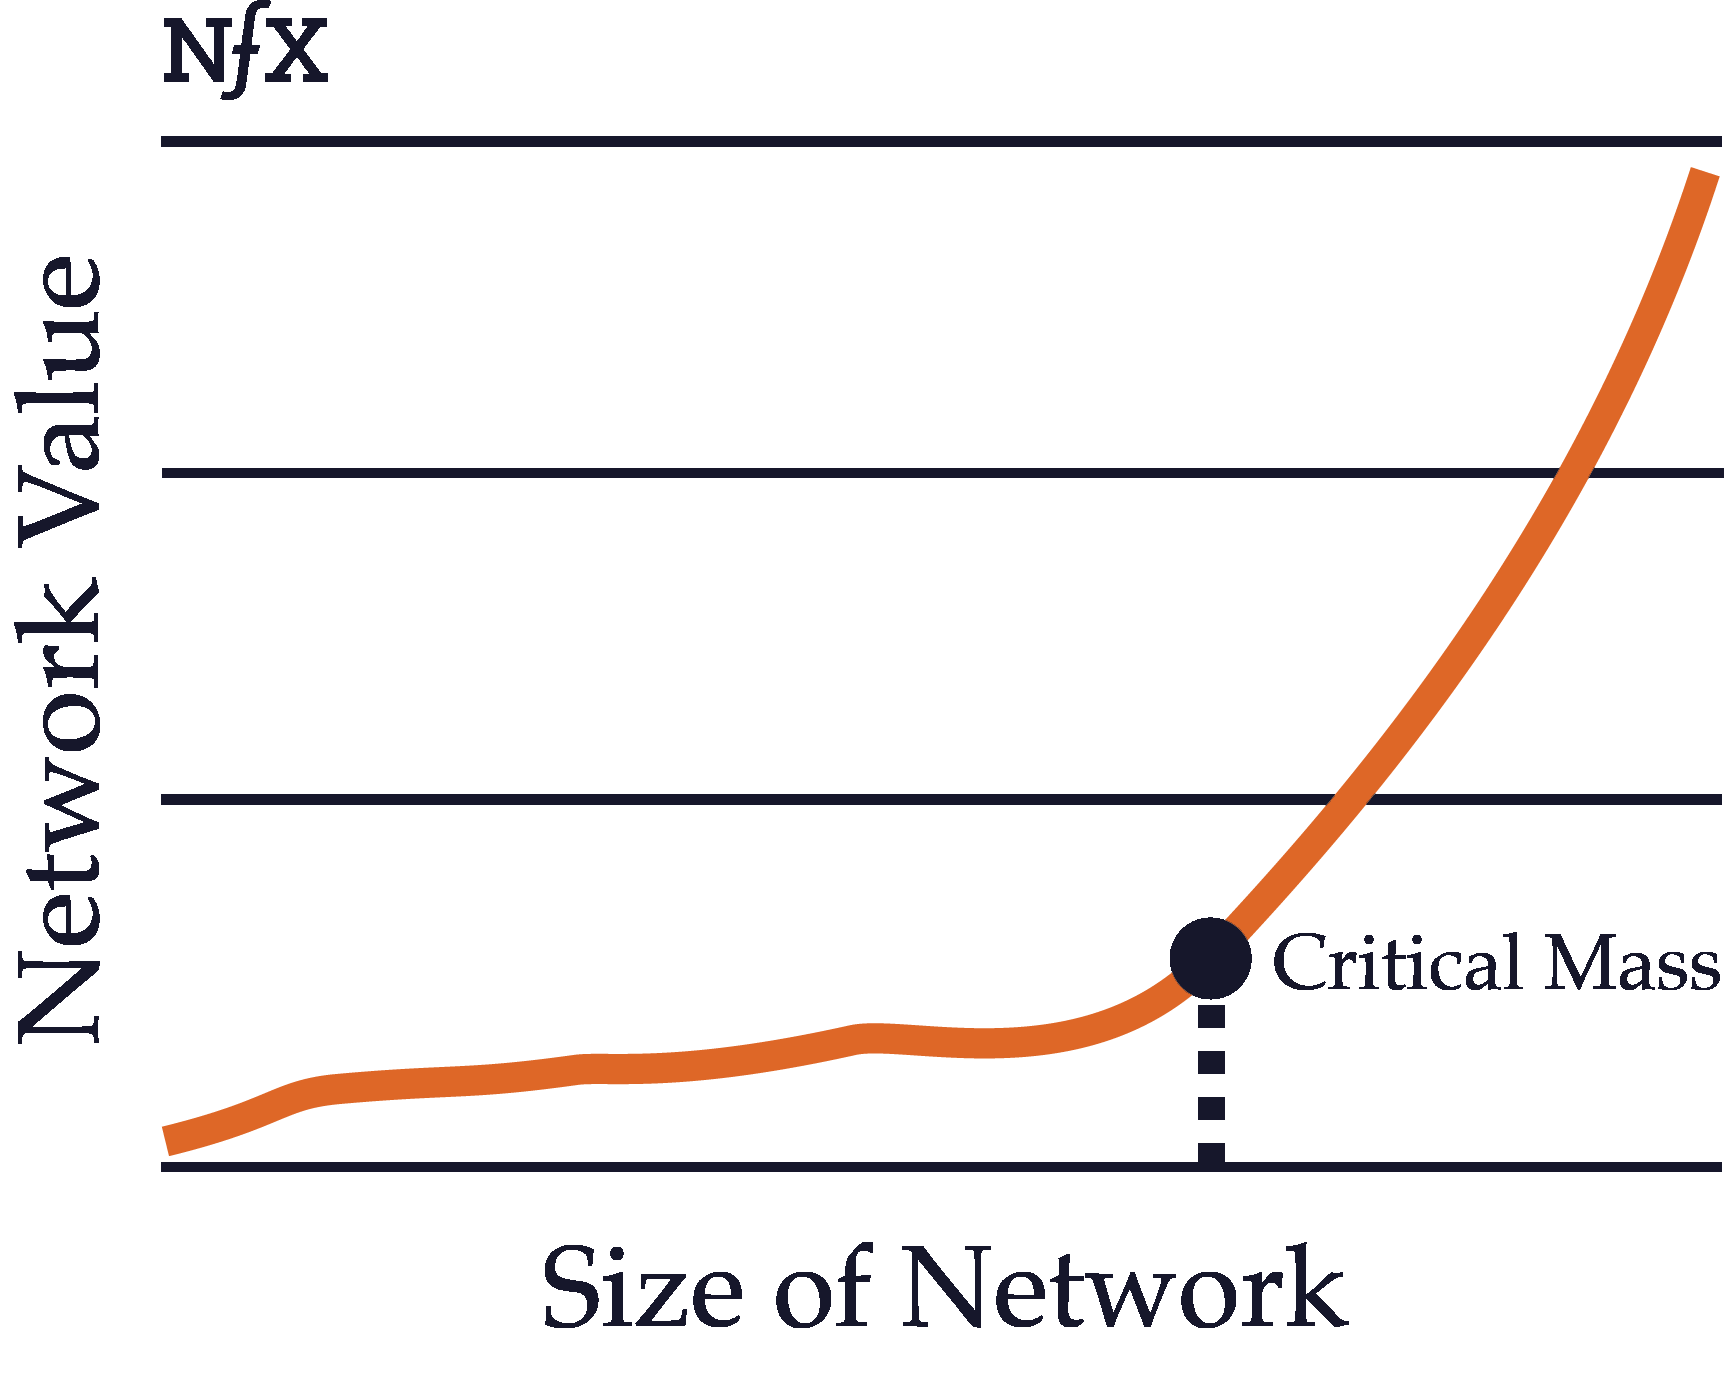
The critical mass of a network refers to the point at which the value produced by the network exceeds the value of the product itself and of competing products. This can happen at different times depending on the type of a network.
For example, physical direct networks such as telephones gain critical mass quite early on. As the chairman of AT&T , “a telephone — without a connection at the other end of the line — is not even a toy or a scientific instrument. It is one of the most useless things in the world.” Since one telephone without any connections is utterly worthless, a telephone network with even two users has sufficient value to exceed the inherent value of a single product on its own.
Contrast that with a platform network like Windows or iOS. The value of the Windows operating system, even without any programs or applications, is quite high on its own. Only after the network of users and developers has grown quite large does the value of all the third-party programs, plus the value of the interoperability with other users, exceed the value (for users) of the Microsoft programs by themselves.
Most products with network effects must ultimately reach critical mass in order to fully take advantage of the defensibility provided by their network effects. Before the size of the network reaches critical mass, the product remains quite vulnerable and may not have much value to users. For such products, the challenge is often to build enough initial value to incentivize early adopters to start using the product even before the network effects value has kicked in.
The Network “Laws”
Over the years, various network pioneers have attempted to model how the growth of a network increases its value. In other words, they tried to describe the power of network effects. As time went on, each new law discovered that the value of networks and network growth had been significantly underestimated in the past.
These laws are not true laws in the same way that the law of gravity is a scientifically proven law. They’re simply math concepts that describe the relationships between different types of networks and the value of those networks. They’ve been called laws because it sounds cool. Sometimes you can have aspects of all these “laws” applying to the same network simultaneously.
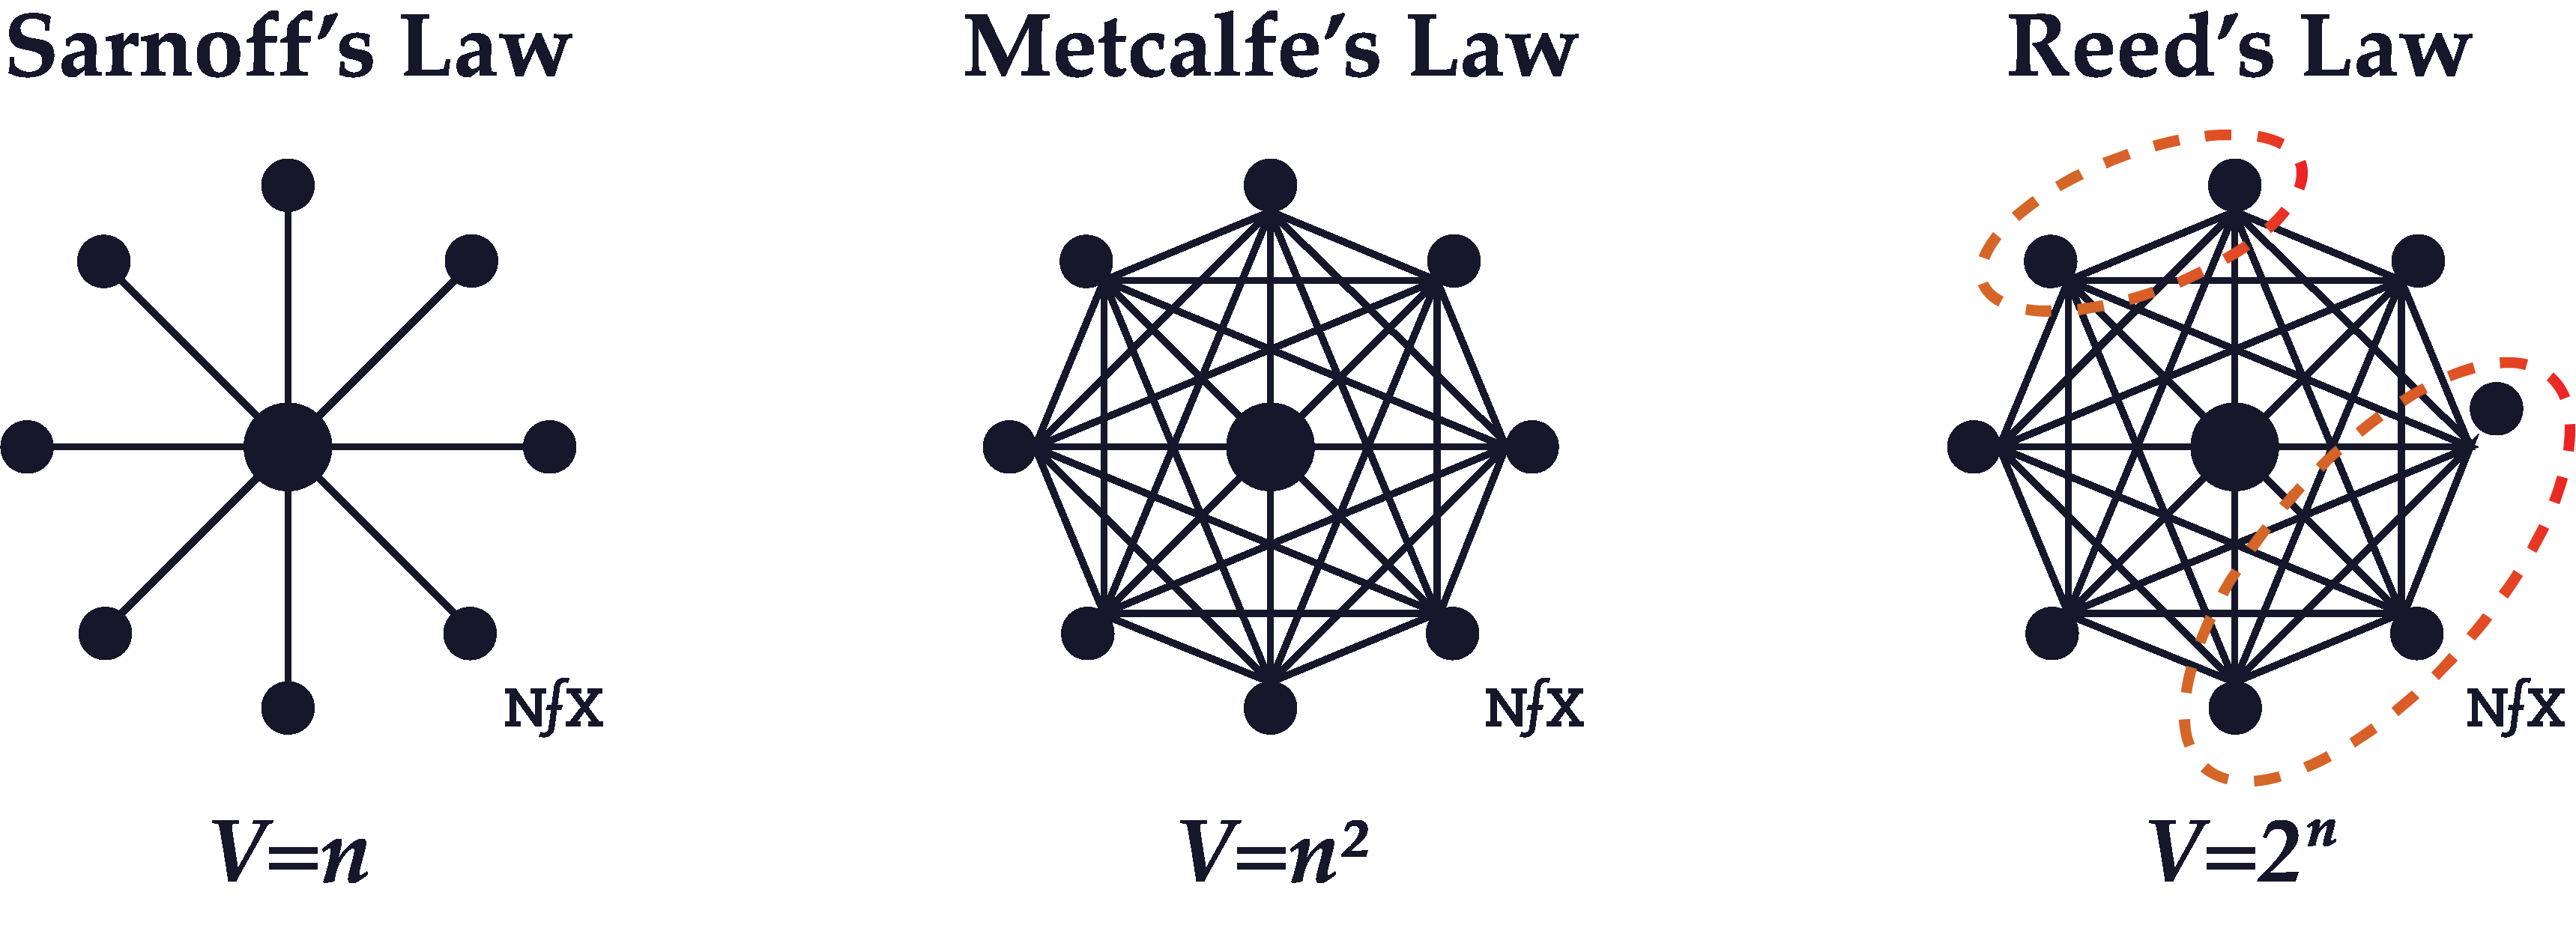
Sarnoff’s Law
David Sarnoff was a titan of broadcast era radio and TV, who led the Radio Corporation of America (which created NBC) from 1919 until 1970. It was one of the largest networks in the world during those years. Sarnoff observed that the value of his network seemed to increase in direct proportion to the size of the network — proportional to N, where N is the total number of users on the network.
As it turned out, Sarnoff’s description of network value ended up being an underestimate for some types of networks, although it was an accurate description of broadcast networks with a few central nodes broadcasting to many marginal nodes (a radio or television audience).
Metcalfe’s Law
Metcalfe’s Law states the value of a communications network grows in proportion to the square of the number of users on the network (N^2 where N is the total number of users on the network).
The formulation of this concept, which dates to about 1980, is attributed to Robert Metcalfe, who was one of the inventors of the Ethernet standard.
Metcalfe’s Law seems to hold because the number of links between nodes on a network increase mathematically at a rate of N^2, where N is the number of nodes. Although originally formulated to describe communication networks like Ethernet, fax, or phone networks, with the arrival of the internet it has evolved to describe social networks and marketplaces as well.
Reed’s Law
Reed’s Law was published by David P. Reed of MIT in 1999. While Reed acknowledged that “many kinds of value grow proportionally to network size” and that some grow as a proportion to the square of network size, he suggested that “group-forming networks” that allow for the formation of clusters (as described above) scale value even faster than other networks.
Group-forming networks, according to Reed, increase in value a rate of 2^N, where N is the total number of nodes on the network.
The reason why Reed suggested a formula of 2^N instead of N^2 is because the number of possible groups within a network that “supports easy group communication” is much higher than 1, so that the total number of connections in the network (the network density) is not just a function of the total number of nodes (N^2). In reality it’s a function of the total number of nodes plus the total number of possible sub-groupings or clusters, which scales at a much faster rate with the addition of more users to the network.
Since most online networks allow for the formation of clusters, they will likely behave at least somewhat as Reed’s Law suggests and grow in value at a much faster rate than either Metcalfe’s Law or Sarnoff’s Law suggest.
Part III – Network Properties
Irregularity
Networks are not usually uniform in real life. They just look that way in diagrams. They have clusters, hot spots, and dead spots. These mirror the irregularities of complex systems in the real world. Examples include geography (e.g. urbanites behave very differently than rural people), real-world relationship differences (manager-employee relationships are different from peer-level coworker relationships), size (a company with two people will make decisions differently than one with 30 people or 500 people), and many others.
You need to recognize these irregularities, find the “white-hot center” within the network, and focus on it initially to build up a network effect before you expand your focus to the broader network.
Real Identity vs Pseudonymity vs Anonymity

Many network effect businesses require users to create a profile that’s visible to other nodes in the network. Networks with profiles tied to a node’s real identity, like your real personal name or real company name, are typically more effective at building network effects than networks with pseudonymous profiles (e.g. user-generated handles like “Tiger123”).
It’s not a coincidence that the three largest and most successful social networks in the Western World — LinkedIn, Facebook, and Twitter — are also the first that successfully offered real identity profiles at scale (although Twitter does allow the use of pseudonymous handles, the identities people use are usually tied to their real-world identity, e.g. “@realDonaldTrump”). All the hundreds of social networks that launched before real names became acceptable eventually died.
Real Identity is also critical in two-sided marketplace and platform network effect businesses where trust and reputation facilitate the liquidity of transactions.
One caveat: there are some applications, in crypto or government spy work, where anonymity is a necessary feature of the network. Typically, however, such networks collapse in short order for three reasons: a) when the anonymity of the network breached and trust in the system ends, b) when what is being transferred between nodes becomes too low quality as anonymous free riders drag the network down, and 3) as the anonymous network becomes unacceptable to the rest of the world and authorities of various kinds (such as governments) step in.
And let’s be clear, with Telegram, for instance, while users’ messages are encrypted, they use it because it allows them to connect to real identities, not anonymous people. Privacy is different from anonymity.
Asymmetry
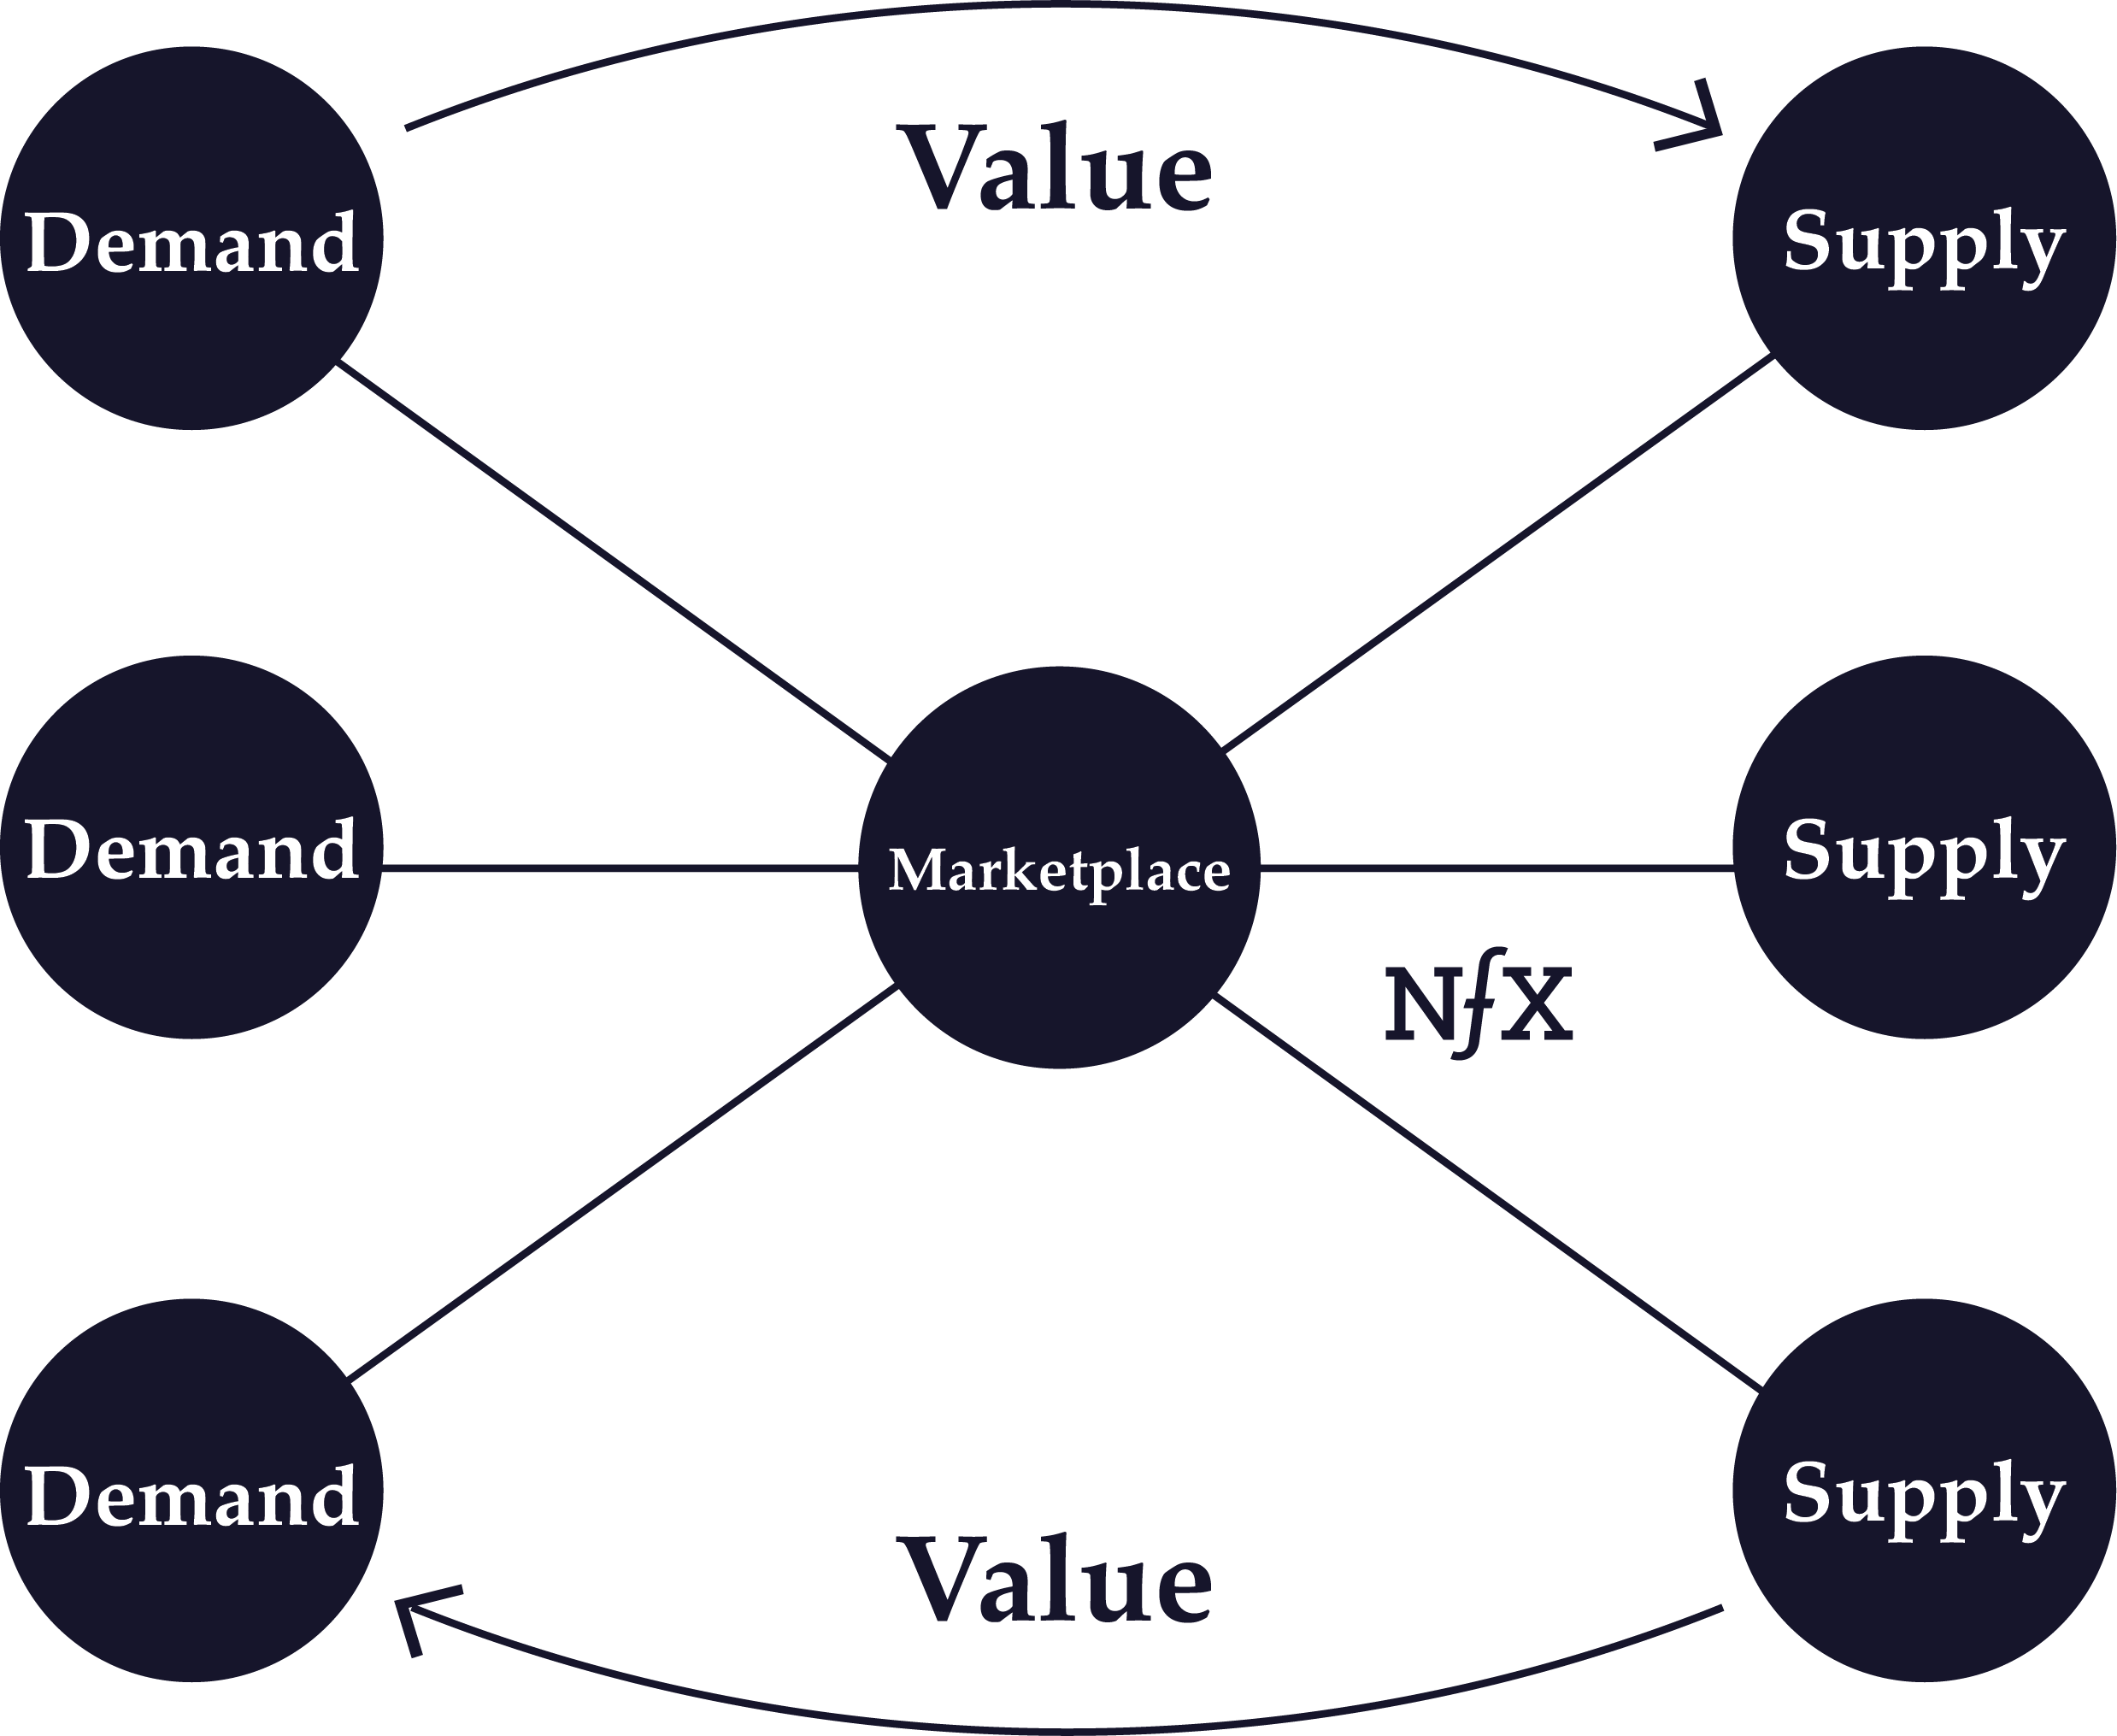
This term relates mostly to marketplaces, whether that marketplace is 1, 2, 3, or N-sided. In nearly every marketplace, one side, or one type of node, is harder to acquire than the other.
In some cases, the harder side of the marketplace is the demand side — the buyers. Usually in this scenario, if you can manage to attract people who are willing to pay (buyers), suppliers (sellers) will show up quickly and without as much effort. We call this a “demand-side marketplace”.
Fiverr and UpWork are examples who focus on finding demand and rely on supply to show up organically. Lending Club is another example. They focus their efforts on finding demand (borrowers) for the money, and the lenders show up on their own to provide the money for those borrowers.
In some cases, the harder side is the supply, and demand-side users are attracted to the marketplace organically once the supply side is robust. We call this a “supply-side marketplace.” For instance, Uber and Lyft spend the majority of their paid acquisition budget on driver acquisition — the supply side. Similarly, OpenTable had to slowly acquire restaurants, the supply side, one by one, until it had built up enough supply after seven years to attract demand (people looking to make restaurant reservations).
Of course, in some markets, if you are unlucky or unwise in your target sector, you will find that both sides are equally hard to attract. That makes things very hard.
Another asymmetry in marketplaces relates to the asymmetry within a side or within a type of node. In other words, not all supply or demand is made equal. Typically, there are certain nodes who will prove more valuable to get on your network, sometimes proving up to 1,000X more valuable than other nodes.
Look for these various asymmetries in a marketplace and prioritize which types of demand or supply will be the best to attract first, second, and third. Then focus on developing tactics to crack the highest-value target first.
Homogeneous vs. Heterogeneous Networks
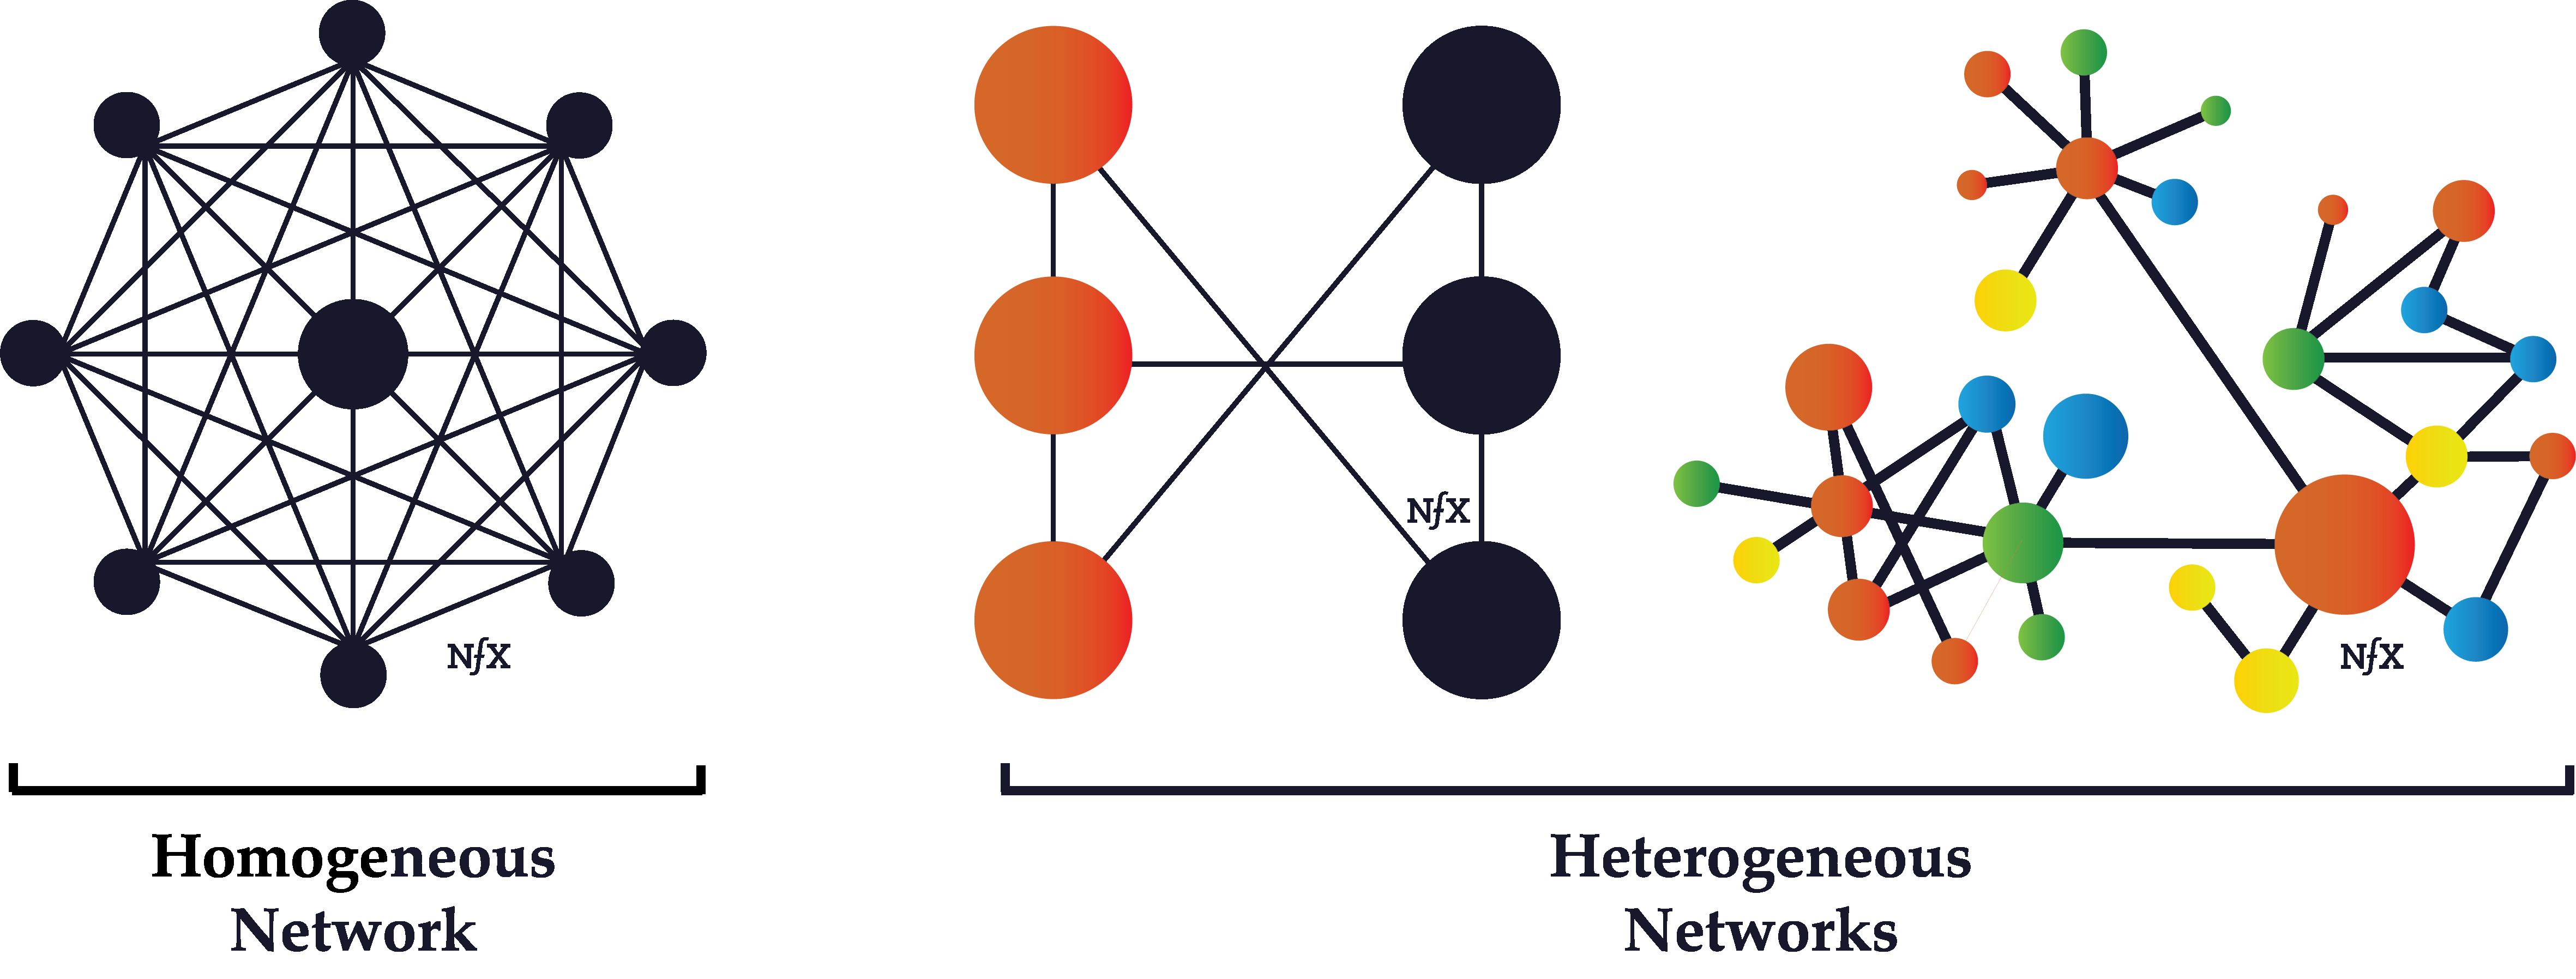
Homogeneous networks are networks where all the nodes have the same function in the network. One user is interchangeable with the next in the basic function they perform. In a landline telephone network, for example, each node (telephone) performs basically the same function as any other, and people tend to get telephones for the same reasons. Telecommunications networks, in general, are often homogeneous.
Heterogeneous networks are networks where there are two or more classes of nodes categorized by both function and utility. On the Honeybook market network, event planners behave differently than photographers, who behave differently from florists. Buyer nodes on eBay are on the network for fundamentally different reason from seller nodes.
Asymptotic Network Effects
Asymptotic network effects are network effects with diminishing returns.
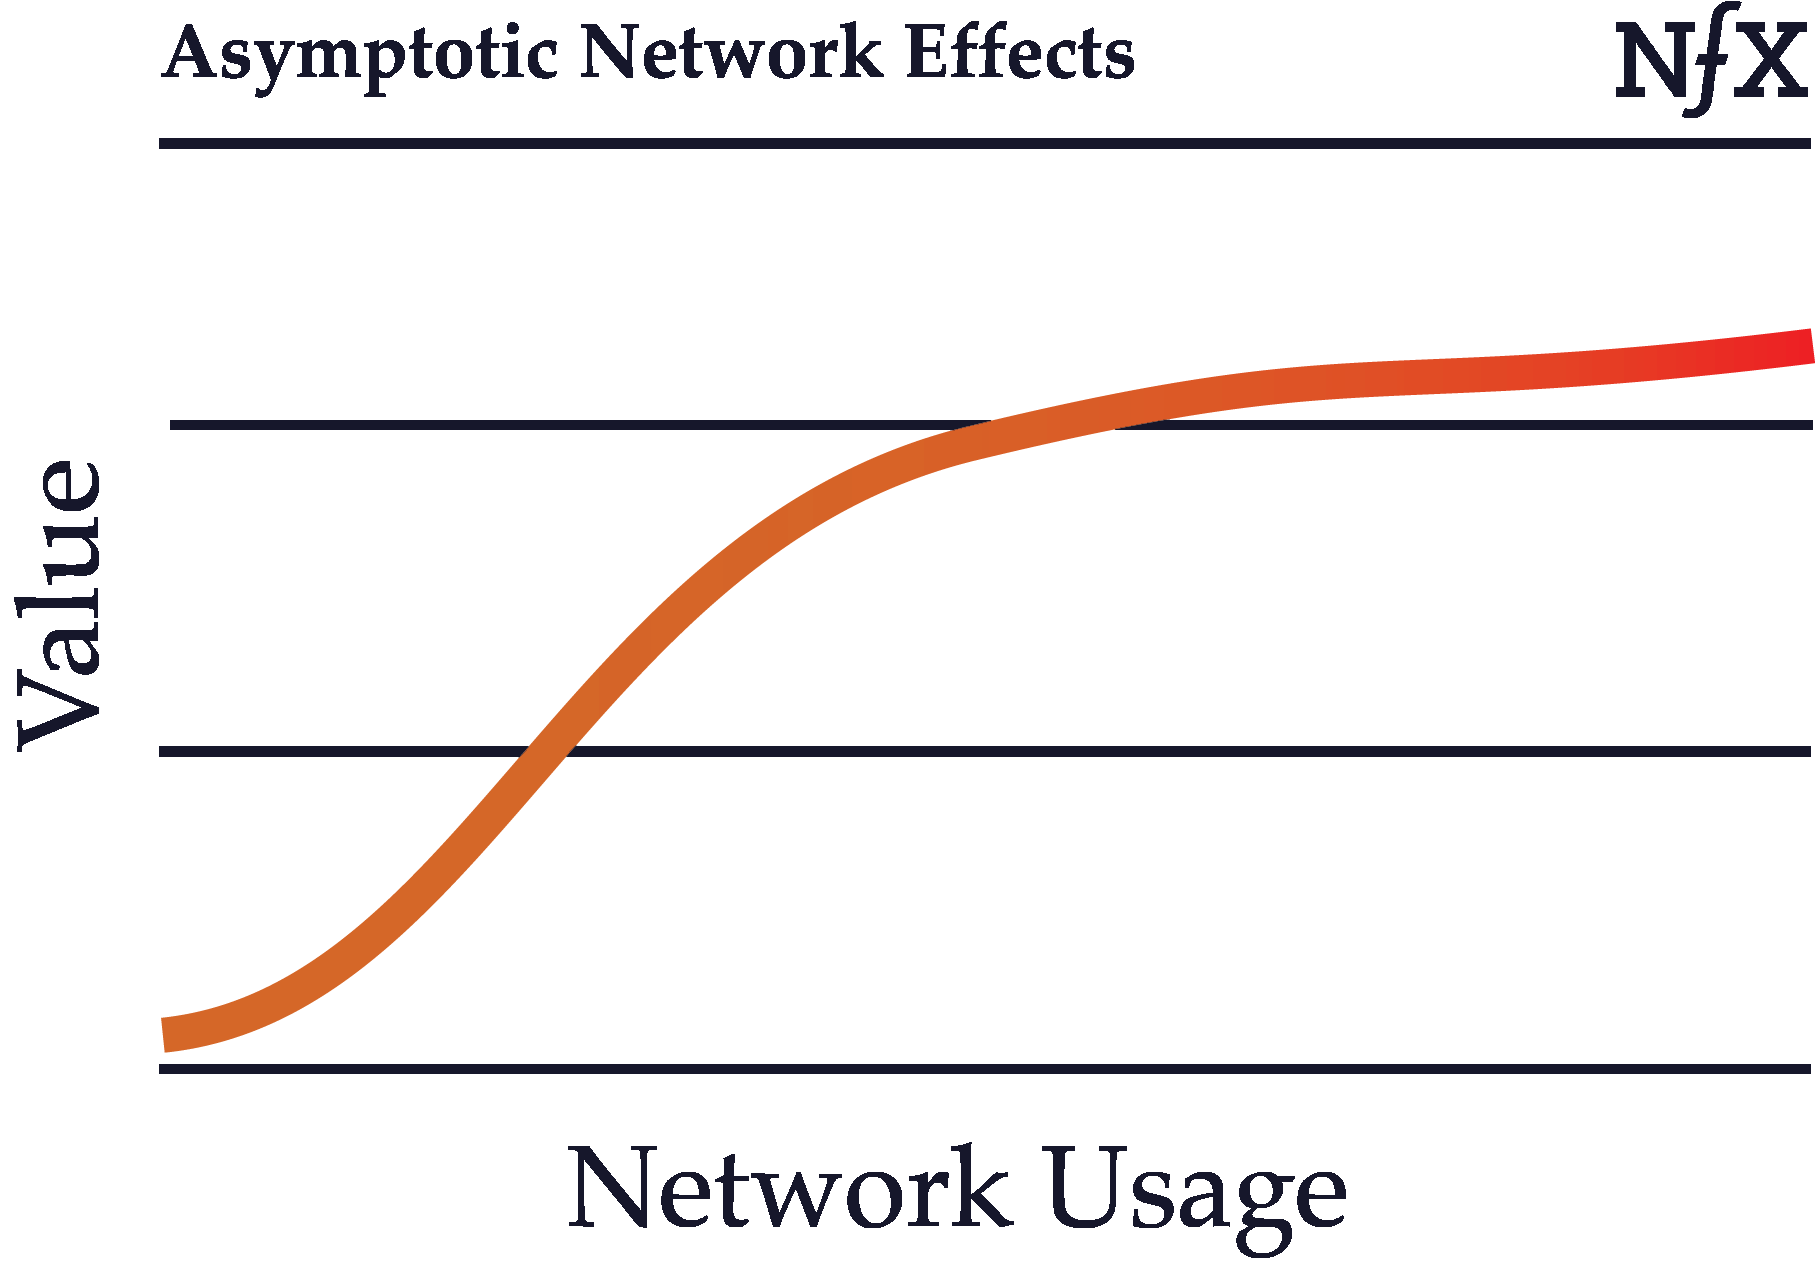
Recall the basic definition of network effects: as usage of a product grows, its value to each user also grows. In some cases, however, network effects can start to weaken after certain point in the growth of the network. Growth in an asymptotic network, after a certain size, no longer benefits the existing users.
Uber is one example of this, since after about a 4-minute wait time, Uber passengers no longer benefit much from an increase in the number of drivers. The value of more supply “asymptotes” as the growth in value approaches zero for the demand side.
Many data network effects, for example, are asymptotic. After the dataset reaches a certain size, the algorithm no longer meaningfully improves as the dataset grows. Most data network effects suffer from this property. Businesses like Waze do the best job of avoiding this, because that service requires real-time data that must be continually updated by thousands or even tens of thousands of nodes to be minimally useful.
Same-Side Network Effects
Same-side network effects are direct network effects that occur on the same side of a multi-sided (2-sided or N-sided network). Same-side network effects refer to the change in value that occurs for users on the same side with the addition of users on that side.

For example, Uber actually has negative same-side network effects or a congestion effect. That’s because at any given time, a greater number of riders means a higher price point or a higher wait time per ride. The same is true for drivers — more Uber drivers mean more competition for other drivers.
Same-side network effects can also be positive, however. This is the case for Windows users, who benefit from the addition of new Windows users because of file compatibility. Two Windows users can easily share files amongst themselves, and the number of people you can share files with grows with the number of people using the same platform.
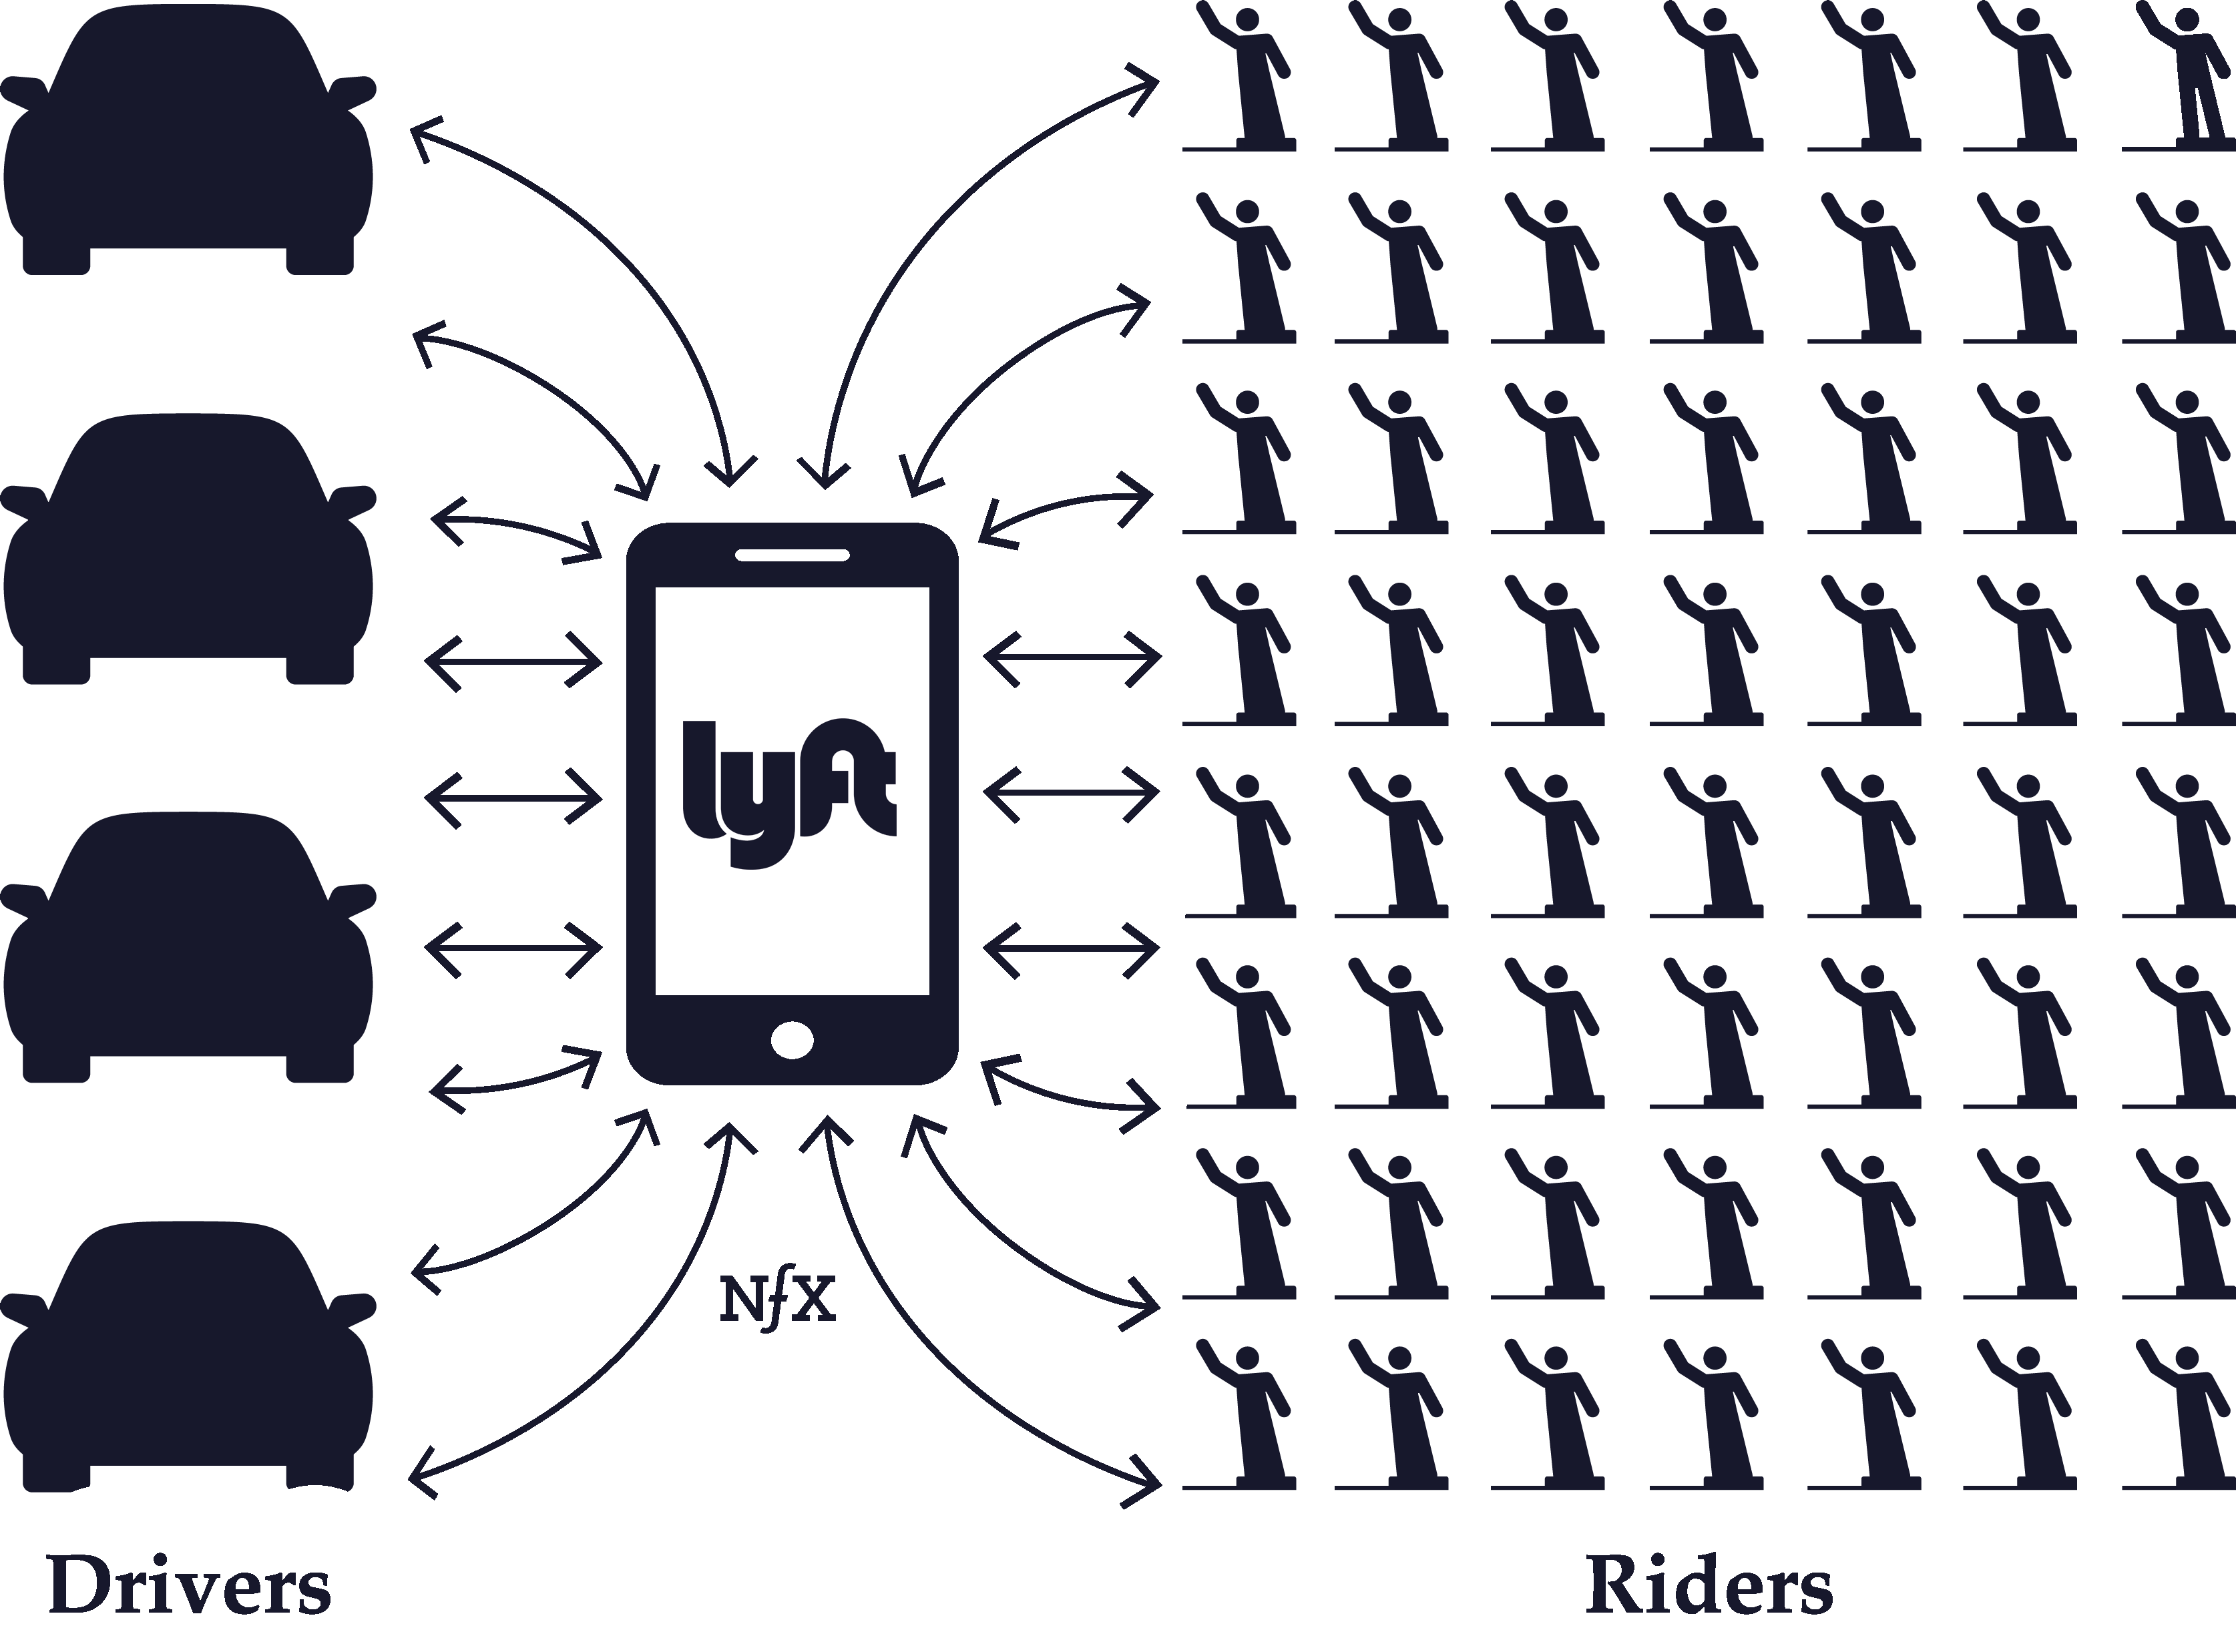
Cross-Side Network Effects
Cross-side network effects are direct network effects that arise from complementary goods or services in a network with more than one side. As opposed to indirect network effects, cross-side network effects refers specifically to the direct increase in value to users on one side of a network by the addition of users to another side.
So to take the example of Uber yet again: there are large positive cross-side network effects because each additional driver adds direct value to all the users on the passenger side () and vice versa.
Indirect Network Effects
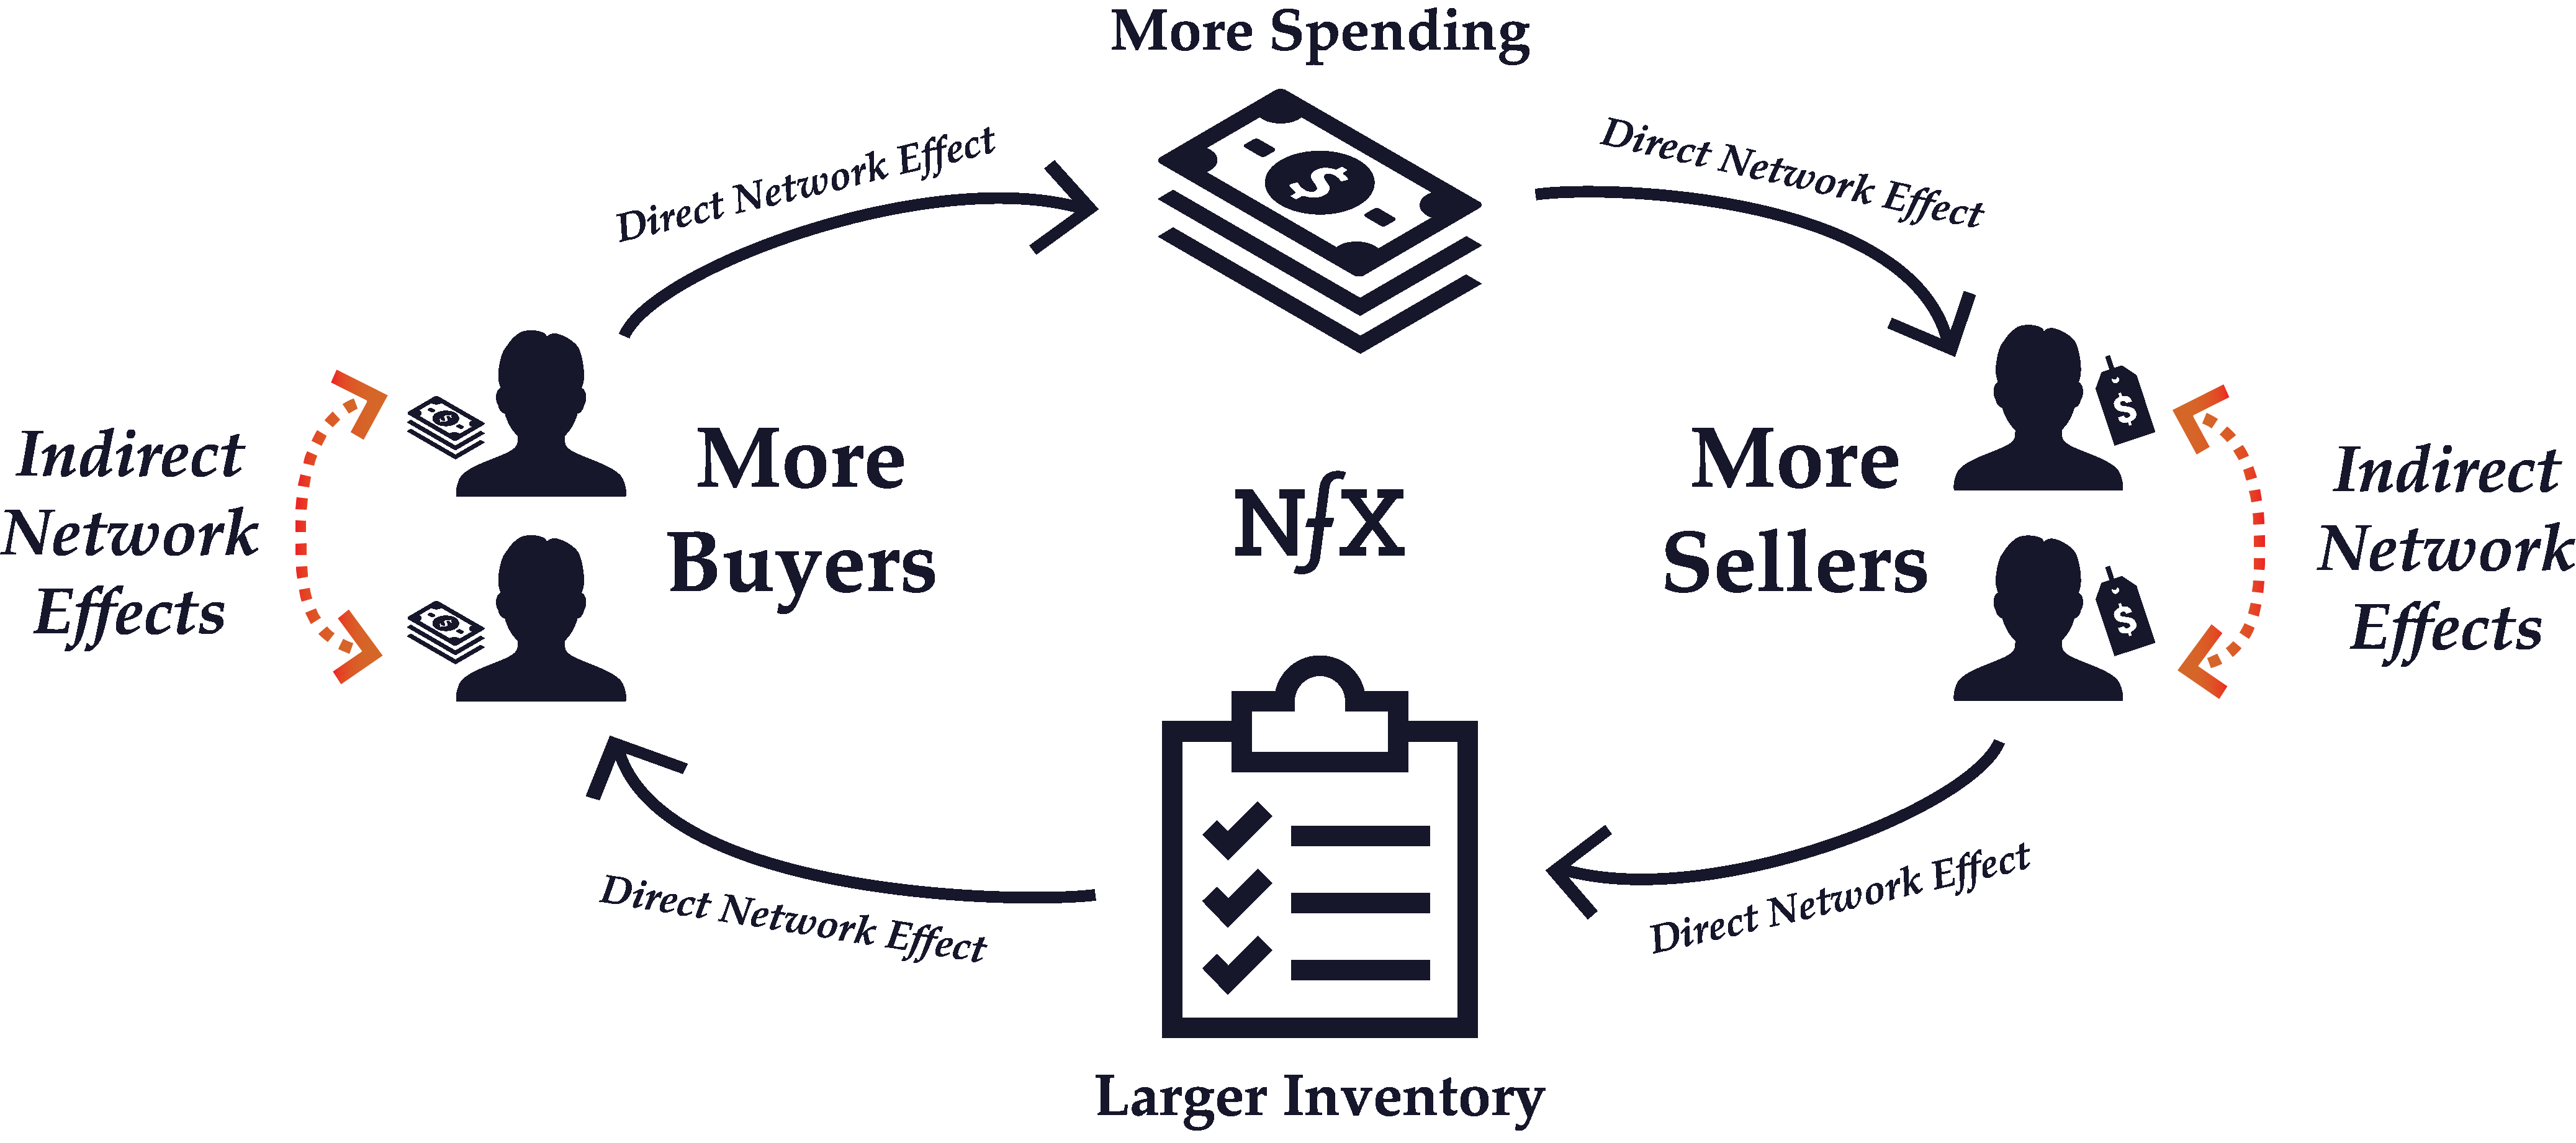
Indirect network effects occur when the value of a network increases as a result of one type of node benefitting another type of node directly, but not directly benefiting the other nodes of its same type. Same-side nodes indirectly benefit each other because they create an increased incentive for complementary users on the other side of the network to use the network, which in turn benefits all the nodes on the same side.
For example, in a 2-Sided Marketplace like eBay, the addition of a new seller does not directly benefit other sellers. In fact, another seller just means more competition for all the other eBay sellers. However, because an expanded inventory of goods makes the marketplace as a whole more attractive to buyers, additional sellers end up indirectly benefiting other sellers because of the total increase in potential customers. There’s a powerful indirect growth in the value of the network for sellers with every new seller.
OS platforms like Microsoft Windows are another good example of indirect network effects at work. New Windows developers don’t directly benefit other developers. However, with an increased library of Windows programs, the number of Windows users will grow. And a greater number of windows users are beneficial for all developers because it increases the pool of potential customers for their programs.
This by Economides and Salop is one of the earliest studies of indirect network effects, which it says is a function of the value of “compatible complementary goods”.
Negative Network Effects
In some situations, more network usage or greater network size can actually decrease the value of the network, leading to negative network effects.
Negative network effects can happen in two ways: network congestion (increased usage) and network pollution (increased size).
The most familiar example of network congestion is road traffic. During rush hour, every additional car on the road makes the network of roads in a city more clogged up (i.e. less valuable) for other drivers. Similar congestion can take place in telecommunications networks, although it is rarer for online networks.
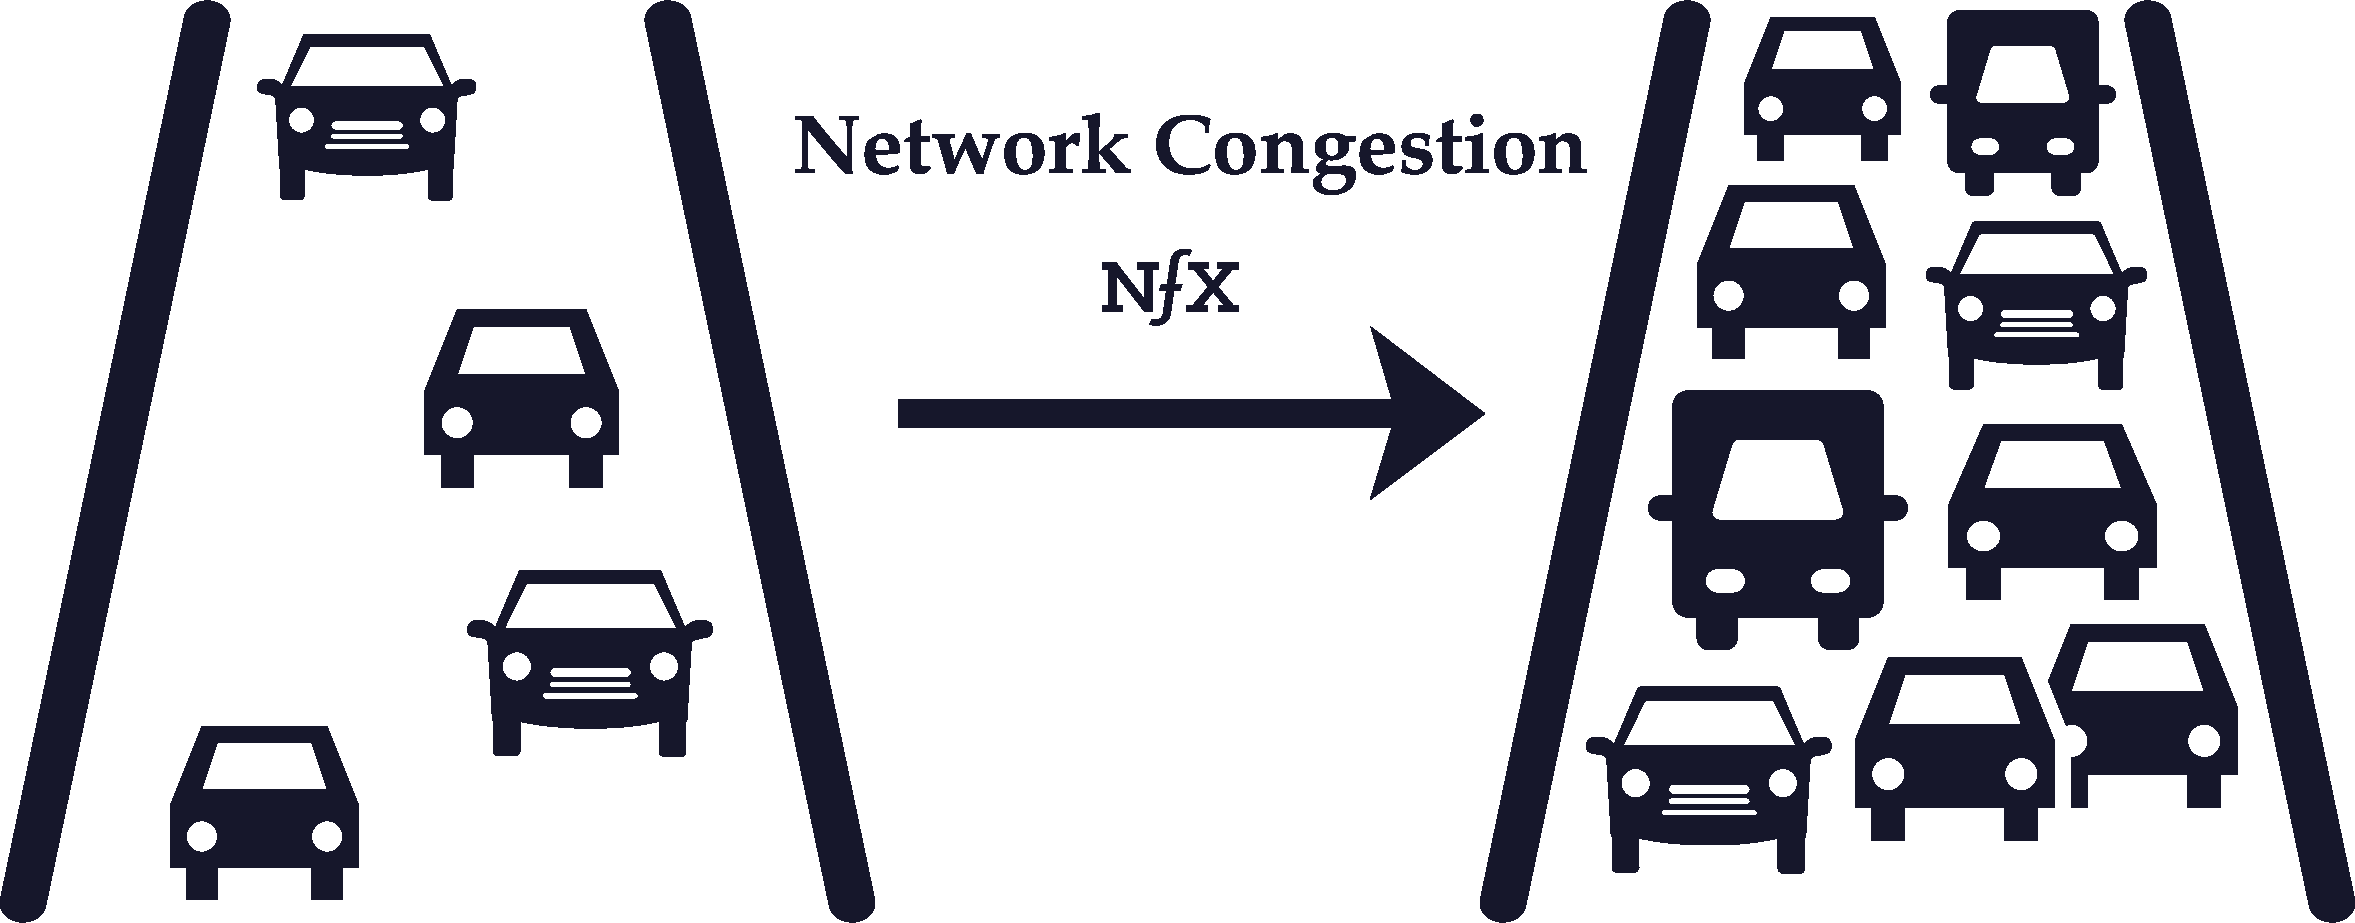
Network pollution, however, is more common for online networks. The wider your social graph grows on Facebook, for example, the more polluted your Facebook News Feed becomes with irrelevant or undesired content from acquaintances you barely know or professional contacts/family members.

It’s possible for networks to have negative and positive network effects at the same time. Twitter and Facebook are two of the best examples, as both Twitter and Facebook feeds show you many people in your network, but if it’s too many, the feed can get polluted.
It’s important for Founders to be aware of this so they can build product features to mitigate negative network effects as much as possible while fostering positive network effects.
Part IV – Building and Maintaining Network Effects
Multiplayer vs. Single-Player Mode

These are terms typically used in the gaming industry. We use them to discuss network effects businesses because they highlight an important distinction.
A single-player product helps the user alone, and can be used without other users there. The user gets value from a product/service in isolation. For instance, buying something off Amazon. Or filing your taxes on TurboTax. Or implementing Stripe on my ecommerce site. It works for me right away, but I get no value from the fact others are also implementing Stripe on their sites.
Users pay for a single-player product based the value it provides them directly, which tends to be linear. All the burden is on you to make your product increasingly more valuable to your customers. This is true of most SaaS companies like WorkDay or Oracle.
“Multiplayer” products, by contrast, let their users feel the presence and impact of the other users of the product, but have a hard time being useful without those other users. Multiplayer products let users add value to each other through their actions, even if it’s just viewing something, like on YouTube. Vimeo, without comments and without video view count, is a single player experience. YouTube, with view count and comments, is a multiplayer experience.
It is possible for products to have single-player value and multiplayer value. For instance, HoneyBook has a tool that lets event planners make more beautiful proposals for their clients. Over time, as more photographers, caterers, and florists join the HoneyBook network, the event planner benefits from the professional network and N-sided payments network that begin to accrue.
It is also very possible for companies to add multiplayer mode to a single-player product, or even to switch their products from single-player to multiplayer. We help companies do that frequently. For instance, Amazon added multiplayer experiences with reviews, allowing past purchasers to benefit future purchasers. They also added a marketplace where hundreds of thousands of sellers joined and began adding value to buyers. For the first time in their history, Amazon’s Marketplace accounts for over 50% of the total units sold according to the . This is a huge shift.
We don’t suggest building single-player-only businesses. They tend to grow linearly and get dragged down by competition.
Switching Costs
Switching costs refer to the costs in time, effort, or money that arise when you switch from using one product to another incompatible product. When switching costs are high, it tends to create customer lock-in because the customer has more of an incentive to stick with the same supplier throughout their life cycle.

Switching costs are related to the defensibility of a business, and also have a lot to do with product compatibility. Companies with high defensibility can usually afford to make their products incompatible with competitors, introducing steep switching costs.
Think of Apple. Buying an Apple product such as a MacBook introduces a whole host of switching costs for incompatible products. If you buy a MacBook, it’s costly to own an Android from an effort perspective because you can’t sync your phone to your computer as easily, you have to use a different calendar application, etc. And when you buy a song or a movie or a book on iTunes, there are high switching costs to then using Spotify or Hulu or Kindle because the libraries are not compatible and your media will be scattered across incompatible services.
All of this creates a lock-in effect for Apple customers, who have to buy everything from Airpods to Apple TVs in order to keep their electronic devices inter-compatible.
Network effects heighten switching costs like these even further. Not only is it costly from a compatibility perspective to switch products, but when the product has network effects, switching costs are heightened on a group as well as an individual level. For example, on a 2-Sided Marketplace like Craigslist, there are high switching costs for apartment renters as a group, because unless apartment seekers all move to a new marketplace at the same time as the renters, it’ll be too prohibitively costly for the renters to leave. Therefore the two sides of the marketplace lock each other into place.
Chicken or Egg Problem (Cold Start Problem)

The “chicken or egg” problem refers to the problem of getting enough critical mass to trigger a positive feedback loop. If the people on a network produce the majority of value for other users, how do you get the first users to join?
This is an especially big problem with (and to a lesser extent with ) because there are two types of users — buyers and sellers (or developers and users) — and one needs to be in place before the other one will have an incentive to join. Kickstarting 2-sided networks requires giving some sort of initial value to the users on one side or another, which is independent of the complementary value that results from the other side of the network being there.
There are at least . Several of them involve creating a single-player mode product that provides value to one side of the marketplace even without a network in place. Others involve attracting one side of the marketplace with compensation, such as cash or leads.
Multi-Tenanting
Multi-tenanting occurs when there are low costs or no costs to simultaneously participating in competing networks at the same time.

This is fairly rampant with social networks. People often syndicate photos or snaps that they share to multiple platforms at the same time (Facebook, Instagram, and Snapchat). It’s also frequent with marketplaces; many people on both sides of the marketplace often use both Uber and Lyft, both eBay and Craigslist, both Etsy and Amazon Marketplace.
Multi-tenanting can harm the defensibility of a network and mitigate network effects, but only up to a point. Ultimately, the bigger network will win out because it will have a higher profile for potential new customers and will be more likely to retain existing customers, even if those customers occasionally multi-tenant. Because the network is bigger, the number of options will be greater and people will only turn to competing networks in moments of dissatisfaction or as a supplement for the value provided by the larger network.
For example, people who use Snap stories may use Instagram stories to reach a different audience. Usage of one service may serve to reinforce and increase usage of the other service as people become more habituated to using both and see greater value from the broad category of “stories” shared on both.
Customers of eBay or Amazon might look to Etsy specifically for vintage products, and although this is a case of multi-tenanting, usage of one reinforces the other because the greater the variety of goods consumers buy online, the more likely they are to shop online.
Disintermediation

Disintermediation is a vulnerability that mostly applies to Marketplaces and Market Networks. It happens when, after initially connecting through a marketplace or market network product, users take future transactions off the product and transact directly. This is a significant problem because retention leading to repeat purchase is the name of the game in most transactional networks.
To help prevent disintermediation, you can provide tools, reputation, insurance, compliance, leads and other incentives. There is an extensive playbook about the many things you can try if your marketplace is challenged with this problem. Some never overcome it.
Retention

Retention is about how often your users return to use your product, and this can make a big difference in network effects. If you have low retention, then it will be very difficult to capture any sort of network effects even as your userbase grows, because the overall usage of your product won’t increase and you’ll lose your defensive position.
In the early days, Facebook had sky-high retention rates. People who signed up kept on using it, so there was mounting value from the network because if you joined later than your friends, chances are high that they’d still be using it and you’d get value from joining. If retention was low, then if you joined too late you’d have missed the trend and you’d be much less likely to stick around yourself.
Networks without effective retention have weak network effects, and weak network effects lead to low retention. Remember that network effects don’t come from the size of the network, but from overall usage.That’s why growing a network’s size isn’t enough, it’s also important to focus on increasing usage.
Get the full Network Effects Bible
Enter your email to receive an easy-to-read PDF version
Part V – Related Concepts
Geometric (Exponential/Non-Linear) Growth vs. Linear Growth

Businesses with neither viral effects nor network effects tend to produce linear, straight-line growth. Linear growth can produce a business, but not the kind of high impact, exciting growth we’re all looking for. We all want the green-line growth curve.
Founders should push themselves and their teams to reach geometric growth, and be able to measure and know the difference when you’ve crossed from linear to geometric growth. Network effect businesses, once they hit the tipping point, typically show this type of geometric growth, either because a) they are viral, or b) their metrics are so good, they can afford to buy the traffic vs other competitors.
Viral Effects & Virality

Viral effects are different than network effects, but many people confuse the two.
Network effects add value to a product when more people use it. The more people use a product with network effects, the more utility each existing user gains from it, so the less likely they are to switch to a competitor. Network effects are about retention and defensibility.
Viral effects are about getting new users to use your product. A product is said to be viral when existing users bring you more users for free. A product or service with viral effects has a “viral coefficient”, which is the number of new users that join as a result of each user. For example, if an average Facebook user in the early days invited enough friends to get two of their friends to join in a certain amount of time, we would say that, at that time, Facebook had a viral coefficient of 2. This would mean exponential growth in the new users joining per day for free.
The confusion between viral effects and network effects stems from the fact that 1) they are both positive feedback loops, and 2) they were experienced together in famous companies like Facebook, Twitter, and WhatsApp over the last 15 years.
However, since we ourselves have created viral effects in over ten companies that went viral enough to attract over 10 million users, we can attest that it is easier to craft viral effects on products than it is to build products with network effects. What’s more, products with networks built in naturally allow for more language to build viral hooks and loops — a subject we’ll expand on elsewhere.
Many products can have viral effects without having network effects. Just because a product is viral doesn’t mean that every new user makes the product more valuable and defensible. Viral effects helped propel Facebook to its current position because Facebook also has a network effect. However, going viral didn’t make , Buzzfeed, or the Sequoia-backed (which raised $27M and died) nearly as defensible or valuable. Their success was flashy but short-lived.
The reverse is also true. Products with network effects don’t necessarily have viral effects. A B2B marketplace could easily use paid advertising to attract buyers and sellers and build a 2-sided marketplace network effect with zero virality. A company could deploy thousands of IoT devices across a city creating a mesh network
For example, you could buy ads on Google to drive both sellers and buyers into a B2B marketplace and build a 2-sided marketplace network effect and still have zero virality. Or, you could pay a city to deploy a thousand IoT devices across a city that creates a mesh network whose performance — due to the network density — is so much better than any others that no competitor could hope to compete until they also deploy a thousand nodes to their own mesh network.
Understanding the difference in network effects and viral effects is important for getting your playbooks right, especially considering how often people mix them up. Make sure that isn’t you. Just because you have viral effects doesn’t mean you have nfx, and vice versa.
“Platform Business Model” (Less helpful term)

This is a recent term that is used to talk broadly about many types of companies with network effects that scale by cultivating external networks and facilitating the means of connection, not the means of production. Those are important ideas. However, we feel the term conflates too many concepts to be very useful when trying to tease out the important elements of what make these businesses really work. We prefer to break out the 13 different network effects and the many attributes of networks. We also reserve the term “platform” for network effect businesses like MS OS, iOS, or the FB Platform product where other Incorporated entities are building their businesses on them.
Reinforcement

The important thing to know about network effects is that once you have one going, it’s much easier to build all the other defensibilities on top of it, including other network effects. This “reinforcement effect” is often underappreciated by Founders, especially when they’re preoccupied by growth. Continually looking for and launching new defensibilities is important because they reinforce each other: the more you have going the better they each work up (although this is only up until a certain point, because trying to do too much at once can detract from operational focus).
Scale Effects

Scale, like network effects, is an important defensibility in the digital era. Scale effects are often confused with network effects because both scale effects and network effects become stronger with more users.
However, they work very differently. The best way to understand scale is that as well-run companies get bigger, their per unit production costs get cheaper. As a scale effect starts to kick in, the company with a scale advantage becomes the obvious mathematical choice for customers.
In other words, more users means greater volume, which means cheaper prices from suppliers, which means lower prices for customers, which means higher conversion rates for ads, which makes advertising more effective than the competition, and so on and so forth.
With scale, the numbers all begin to move in your favor and math is hard to compete with. This concept is known in the academic literature as “economies of scale.” In short, per unit production costs get cheaper. Amazon is the tech world’s leading scale effects company (and now they are adding network effects… watch out).
Brand

Brand is a powerful defensibility, but it’s fundamentally different from network effects. Like with scale, your brand defensibility is correlated with the growth and usage of your product, and so it’s easy to confuse brand with network effects. However, they work very differently.
Brand arises when people know who you are and what you do. A well-established brand identity comes with psychological switching costs. People are less likely to switch to an unknown or lesser-known brand from yours because psychologically they will default toward what’s familiar.
People tend to be risk averse and avoid the unknown. When you have brand recognition, people are familiar with what you are and what you do. That gives you a competitive edge. Brand defensibility is so critical in today’s attention economy that, paradoxically, even negative brand awareness can help make your business more defensible (within certain limits).
Embedding
Embedding is accomplished by integrating your product directly into customer operations so the customer can’t rip you out and replace you with a competitor without incurring significant cost in time, energy, or both. In other words, embedding directly heightens switching costs as part of the process of user adoption.


Embedding can work with network effects to make your business more defensible, but they are separate concepts.
Examples of embedding include Workday, Oracle, or SAP — and as these examples show, embedding is more prevalent when customers are organizations, not individuals (it’s difficult to embed in personal life “operations”). That being said, embedding does exist for B2C products — think of Google drive or iCal.
Want to print your doc?
This is not the way.
This is not the way.

Try clicking the ··· in the right corner or using a keyboard shortcut (
CtrlP
) instead.