Skip to content
Share
Explore

This augmented reality (AR) experience is a simple educational exhibit to Illustrate the impact of some of NM Tech’s hydrology innovators.
All the exhibits are block diagrams with Socorro at land surface. The subsurface geology is fabricated to illustrate the type of environment the researchers worked in. Using the cell phone, the blocks can be rotated and moved using your fingers. The animation loops to repeat the feature exhibited.
To access the AR Experience point your mobile device camera at the QR code and your phone will redirect you to the Instagram camera. For best results, make sure you are using the rear-facing camera in a well lit open area like a table top or floor. Once the filter loads, point the camera at the flat surface and long tap the screen to show and hide the animation.
Mahdi Hantush: Founder of Hydrology Program; Professor 1955-1970

Developed equations to predict water supplies from wells in complex aquifers

Instagram QR
This exhibit shows an irrigation well pumping water onto the NM Tech golf course. The diagram illustrates a complex multi-layered aquifer, with two aquifers separated by a ‘leaky’ clay layer. The well only partially penetrates through the lower aquifer. The exhibit illustrates that as the deep well pumps from below the clay layer, water from the upper aquifer is depleted and flows into the lower aquifer. Groundwater in the lower aquifer flows radially to the well.


 Instagram QR
Lynn Gelhar: Professor 1973-1982
Gave us tools to quantify how contaminant plumes spread in heterogeneous aquifers
The exhibit shows the downward migration of a contaminant spill, followed by the formation of a dissolved plume moving horizontally within the aquifer. The aquifer here is characterized as a heterogeneous mix of mostly sand, with some zones of clay and gravel. The animation shows how the plume moves faster through the gravel, somewhat slower in the sand, and moves little within the clay. The result is a complex plume front which is mixed as a result of the natural geologic heterogeneity.


 Instagram QR
John Wilson: Professor 1983-present ( Emeritus )
His pore-scale models showed how liquid chemicals impact soil and aquifer
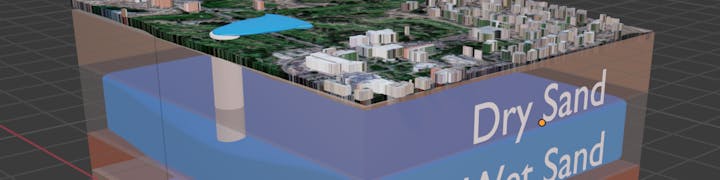
This exhibit illustrates two hypothetical spills a) a denser than water organic solvent, like a dry cleaning fluid, and b) gasoline which is less dense than water. The exhibit shows both liquids move downward through the soil. But at the water table, the less dense gasoline forms a pancake and does not sink through the aquifer. On the other hand, the dense liquid continues to migrate deep into the aquifer.


 Instagram QR
Fred Phillips: Professor 1981-present ( Emeritus )
Applied chemical “fingerprints” to assess aquifer sustainability from the age of the water in wells
This is an exhibit of a classical hydrologic cycle from M-Mountain to east of the Rio Grande. It simply shows that there is recharge from precipitation which enters the aquifer and flows towards the Rio Grande. The upper strata of water were recharged more recently than the lower water zones. Thus, the deeper water is older than the shallower water. Age dating the water allows one to see how recently the aquifer has been recharged.

Want to print your doc?
This is not the way.
This is not the way.

Try clicking the ··· in the right corner or using a keyboard shortcut (
CtrlP
) instead.