Skip to content
 Sparklines for Objectives and Key Results in Coda
Copy template
Note there’s also an automation on the below table so every time you adjust the Percent Complete slider, it creates a new OKR history row. The QuickChart pack then generates a Graph per OKR history entry.
Key Results
Percent Complete
Key Result
Graph
000
79Grow QuickChart Pack users by 1000%
000
49Create 10 new QuickChart templates
There are no rows in this table
OKR history
KR
Percent
Updated
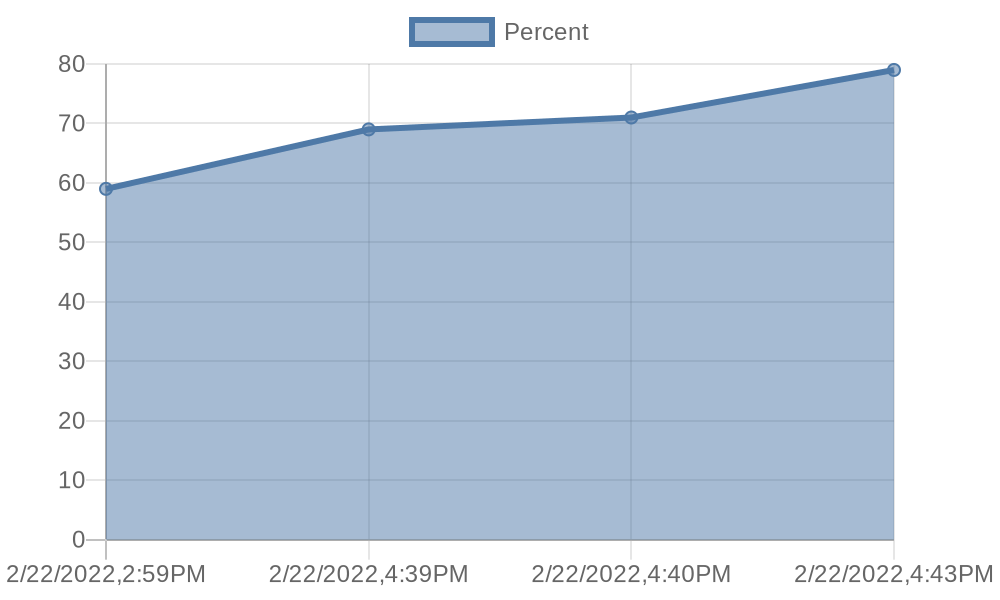
Grow QuickChart Pack users by 1000%
4
000
792/22/2022, 4:43 PM
000
712/22/2022, 4:40 PM
000
692/22/2022, 4:39 PM
000
592/22/2022, 2:59 PM
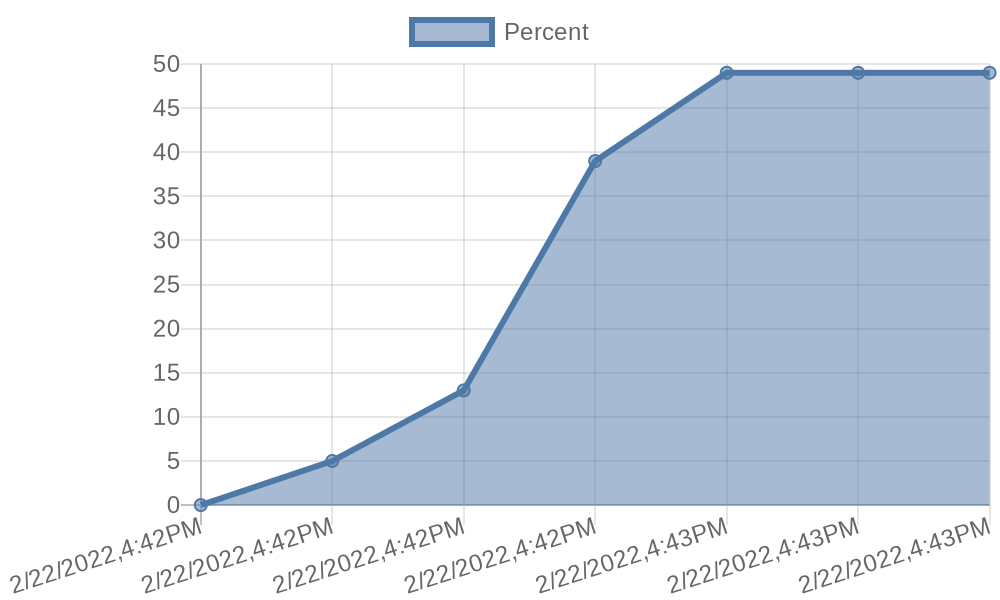
Create 10 new QuickChart templates
7
000
492/22/2022, 4:43 PM
000
492/22/2022, 4:43 PM
000
492/22/2022, 4:43 PM
000
392/22/2022, 4:42 PM
000
132/22/2022, 4:42 PM
000
52/22/2022, 4:42 PM
000
02/22/2022, 4:42 PM
Want to print your doc?
This is not the way.
This is not the way.

Try clicking the ··· in the right corner or using a keyboard shortcut (
CtrlP
) instead.