Skip to content
 How we did it
The solution, step-by-step
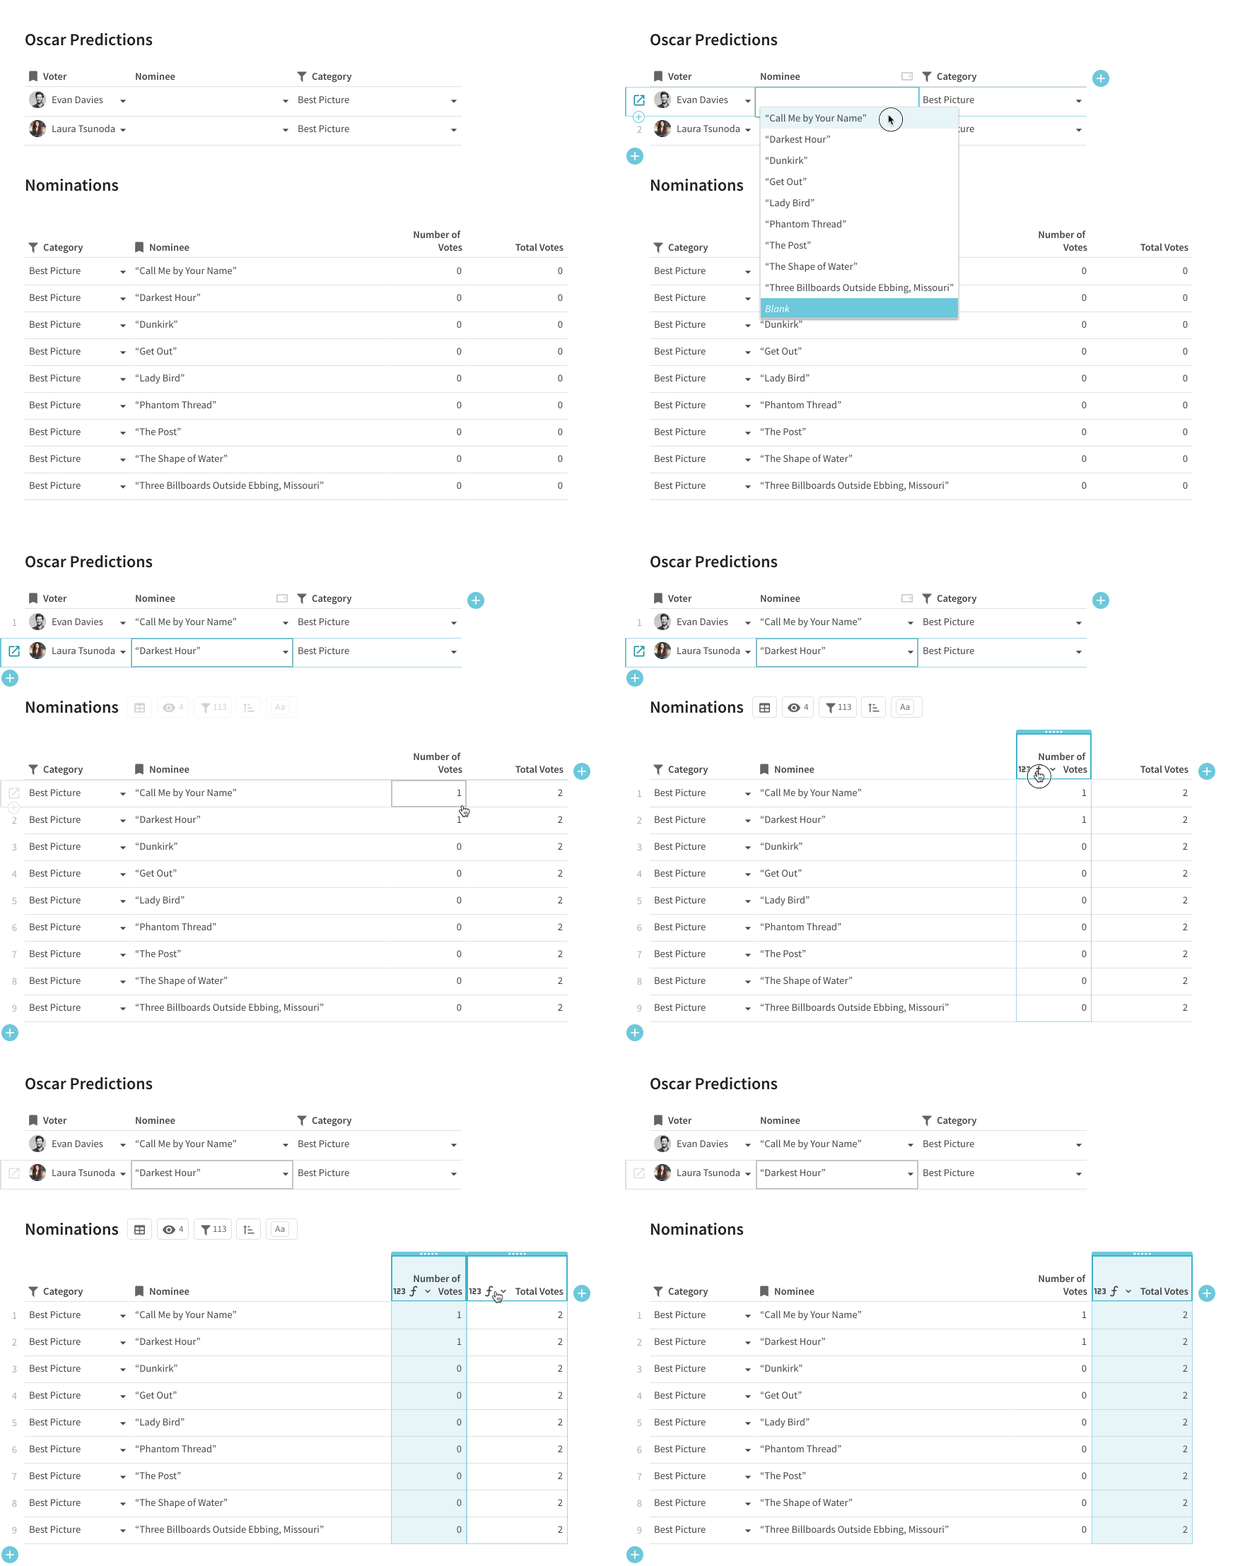
Puzzle #3 starts with a schema hat trick. We show you two tables, but you actually need at least three to solve it. As one puzzler said, “I thought I’d be spending all my time on bars, but I ended up spending 90% of my time on schema.”
So in summary: Three tables (Nominations, Oscar Predictions, and *Categories*), and the Nominations table is where you set up your bars.
Once that’s set up, you need to figure out the cross referencing.
While most of you knew about our “, many were missing the handy , which let’s you quickly match values between tables based on a key field.
=Lookup( table , column , match value )
The basic syntax is straightforward, but can become tricky when comparing a column and match value of different types. The main lesson: make sure you’re matching strings to strings, and . Like in this example summarizing the number of Oscar Predictions for each Nominee in the Nominations table:


Lookups to summarize data from another table (and from within)
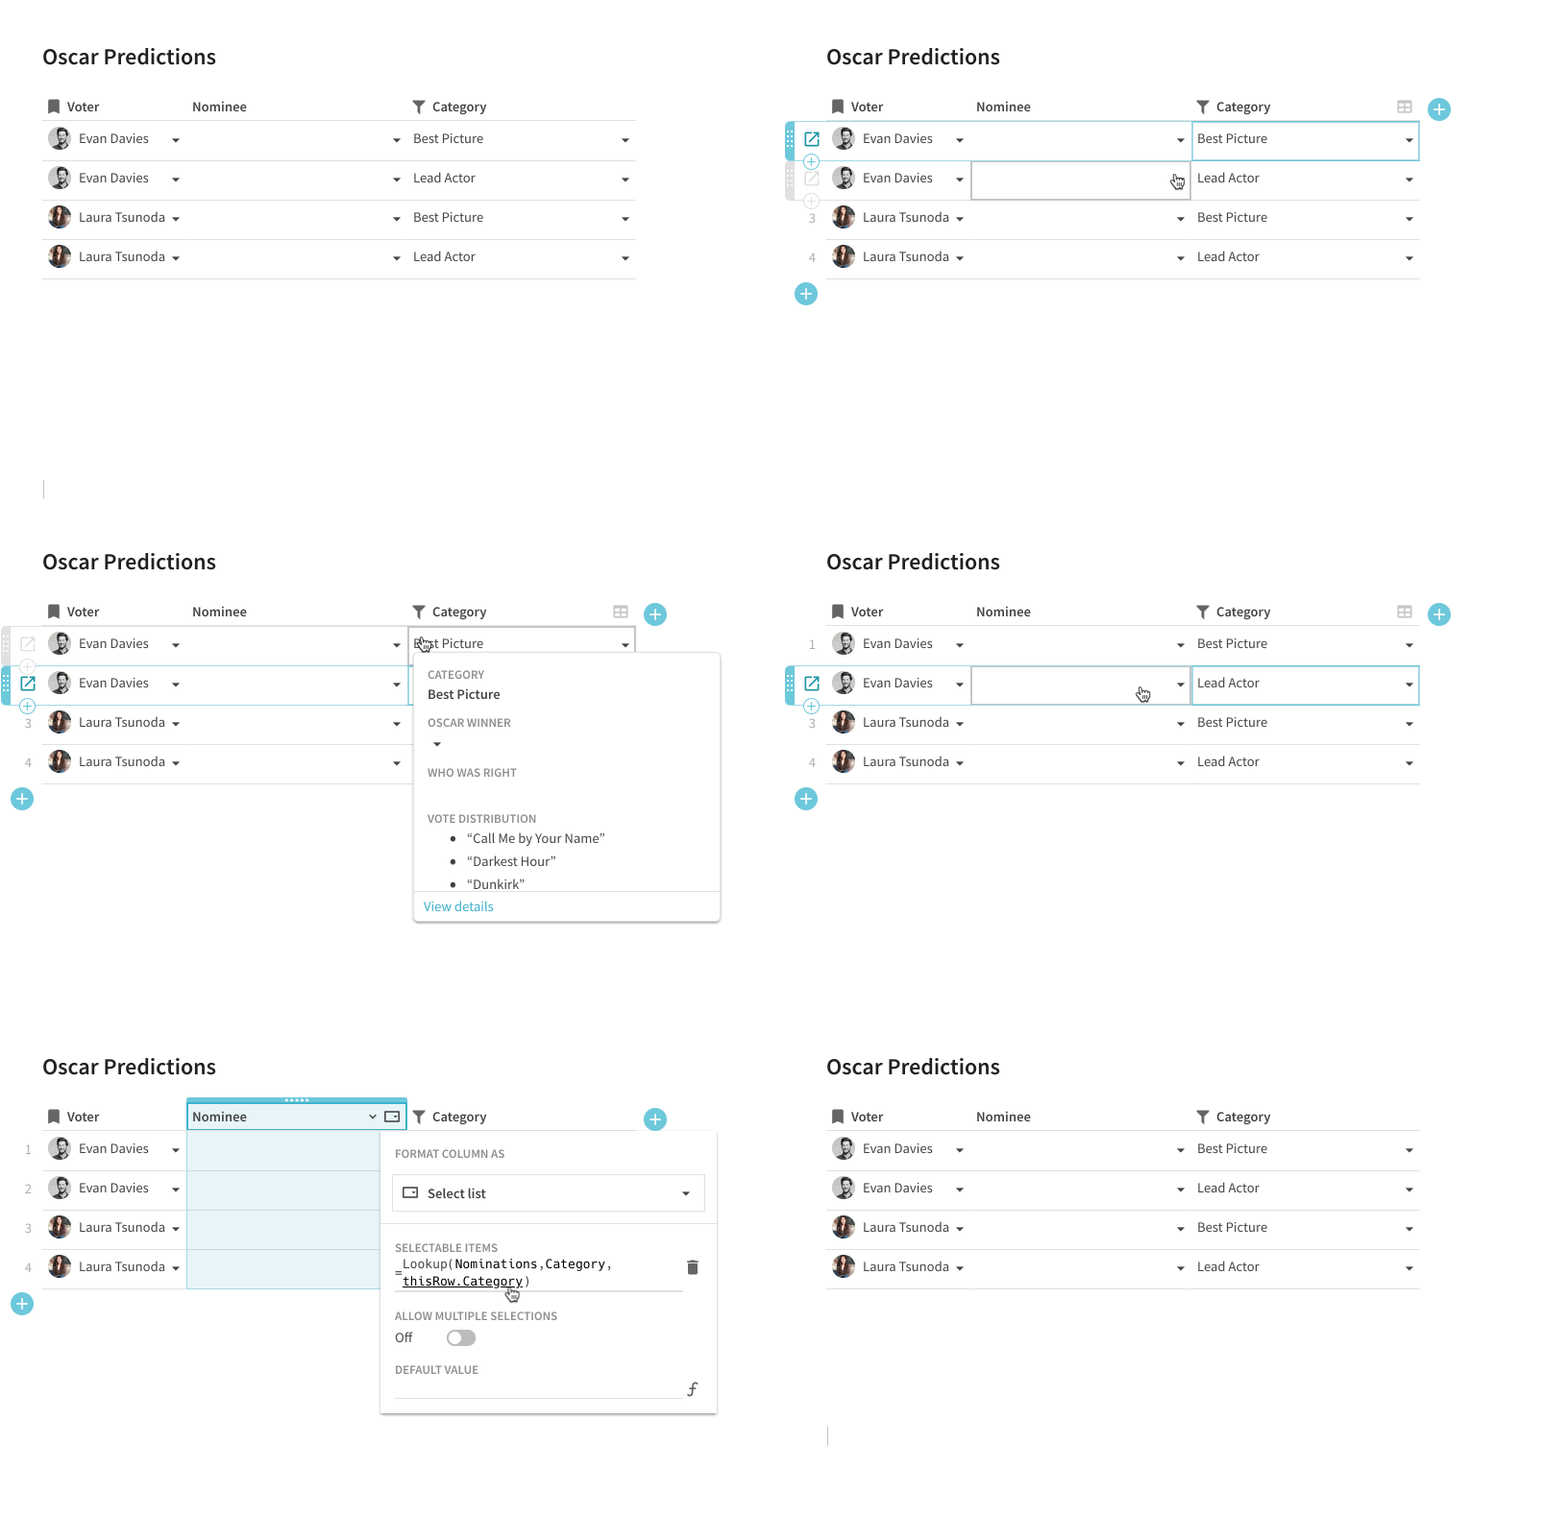
Or this one creating a Nominee select list dynamically filtered based on the row’s Category:


Lookups to dynamically filter a Select List
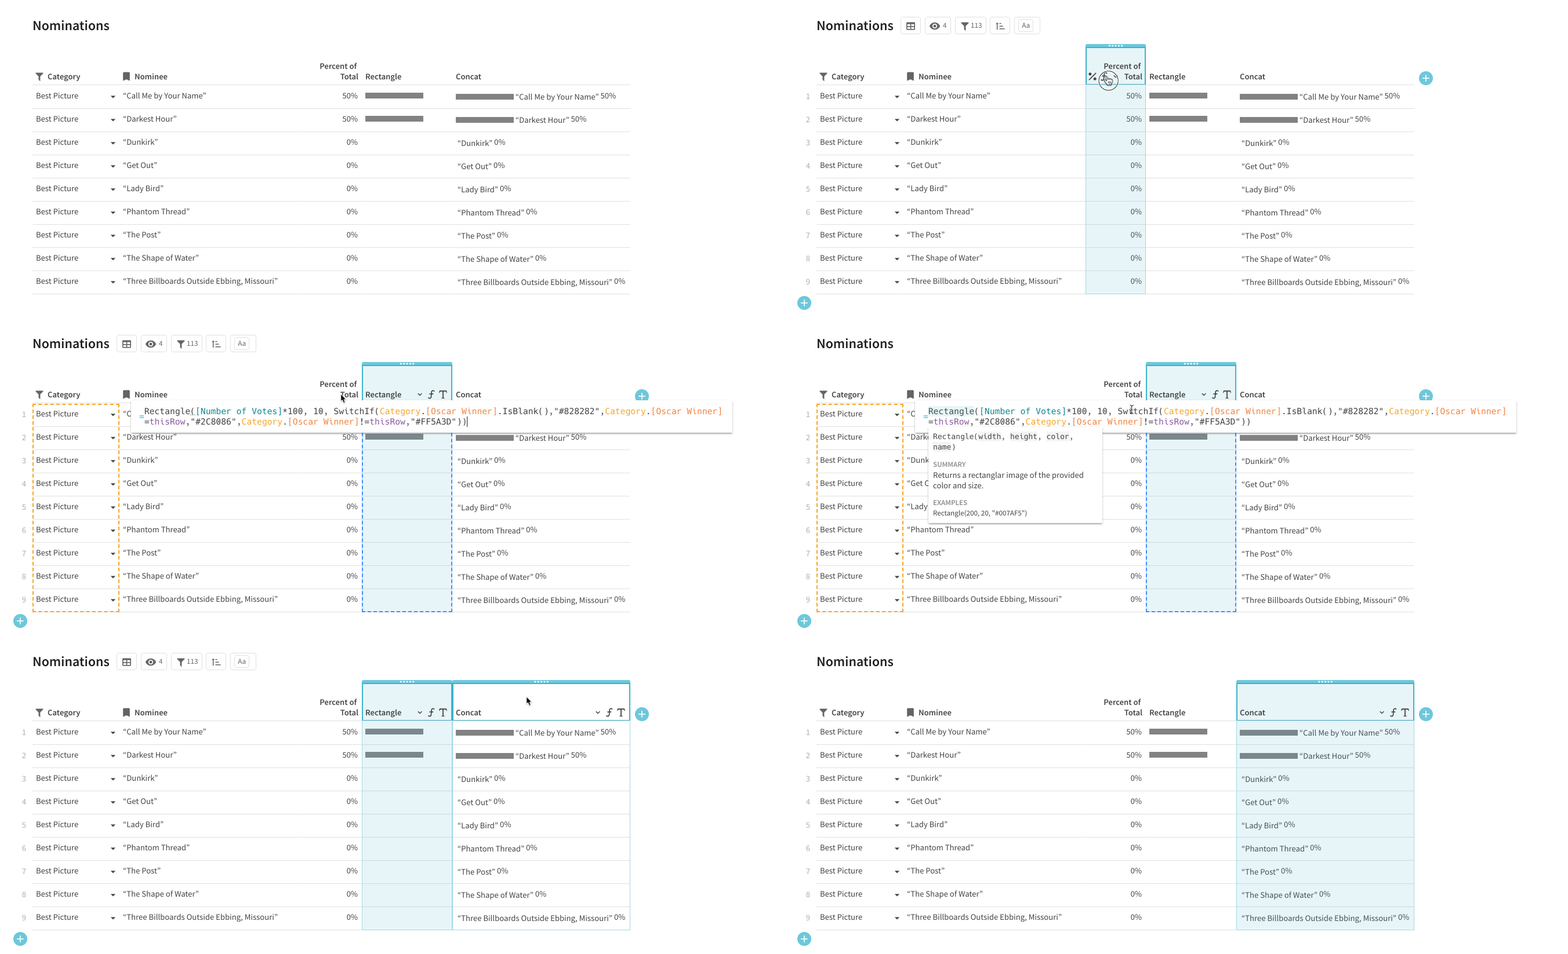
The bar graph visualization is an OG Coda hack, one we use a lot internally but never broadcast. In fact, if you’ve pawed through the template gallery, you may have spotted it in ’s or ’s .


Creating the bars with Rectangle() and SwitchIf()
Another few tricks here are the length of the rectangle — which required a multiple to size appropriately for the space — and the use of SwitchIf() to select the right color. Our good friend Concatenate() brings it all together.
We saw a few fun variants here we weren’t expecting. Snaps to Krunal Sheth for storing the hex code for the Rectangle() color in a separate column for clarity, and for attempting to use the Repeat() formula to solve for length:


Krunal’s creative bars
Also tip of our hat to Brian Eshelman, who found BarChart() and FormulaMap() :


Brian’s use of Barchart()
And the winner of Puzzle #3 is Gavin Gonçalves, who burned through this puzzle in record time. 👏👏👏
Want to print your doc?
This is not the way.
This is not the way.

Try clicking the ··· in the right corner or using a keyboard shortcut (
CtrlP
) instead.