Microsoft Ignite 2018 | Vision Keynote
Microsoft Ignite 2018 | Vision Keynote
Summary of New Excel Features From Ignite 2018
Dynamic arrays to replace array-entered formulas Pretty big paradigm shift in how you will write formulas (start getting used to the #SPILL error message 🤣) To make this more complicated, cell reference in dynamic arrays will contain hashtags (#) Get and Transform your data in Power Query is super powerful when combined with the Flash Fill feature Predicts how you want to transform your data and let's you preview the transformation before you actually commit it Reduced file sizes due to dynamic arrays (only write formula once) and optimized lookup formulas 🙌 New data types seem interesting only if you're a stock broker (tickers) or economist (geography/census data) stock brokerparadigm shiftarraysformulasSummaryDynamicNew Excel Features From Ignite 2018dataformula
Experience the power of Microsoft Excel anywhere with Excel Online - THR1047
Experience the power of Microsoft Excel anywhere with Excel Online - THR1047
Notes
Access anywhere, similar interface, working with the latest version Shareable link with permission setting → Google Sheets anyone? Threaded comments and @mentions Simplified ribbon toggle, thank God! Can create data validation and PivotTables now in Excel Online Bottom Line: Google Sheets had these features 5 years ago. seemed like it's just to get parity with Google Sheets anywhereinterfaceNotesGoogle SheetslinkversionpermissionanyoneShareable
New functions and calculation capabilities in Excel - THR3018
New functions and calculation capabilities in Excel - THR3018
Notes
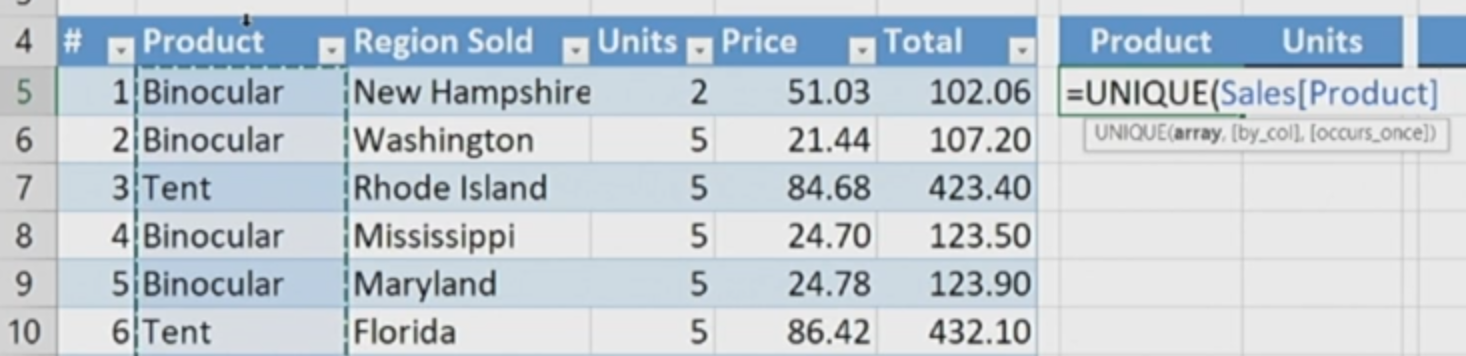
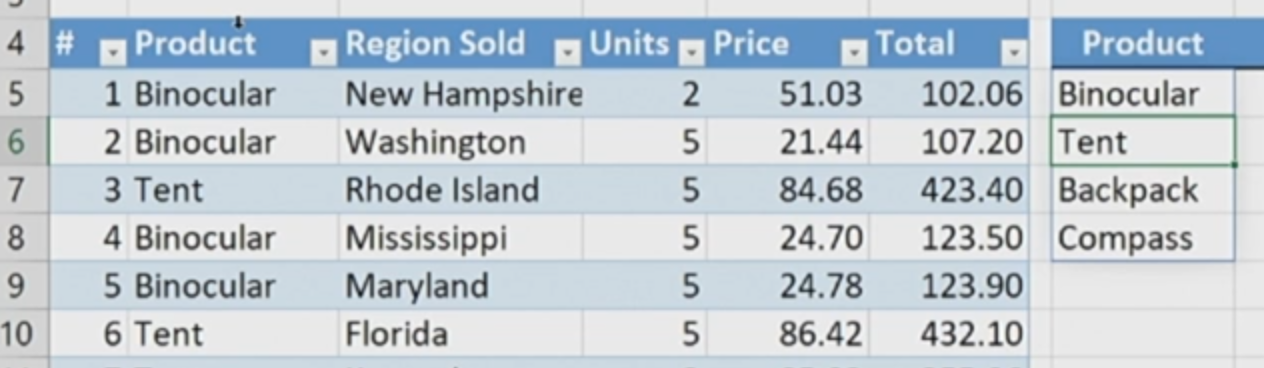
Introduction of dynamic arrays is a pretty big paradigm shift for Excel users Formulas can "spill" into other cells with a blue border around the spilled cells denoting which cells are in the "spill range" A little bit like array-entered arrays with CTRL+SHIFT+ENTER because you can't overwrite a formula in the spill range → not all cells in the spill range have a formula Spill range referencing → instead of doing H5:H8, you do H5# to get a dynamic reference (crazy! 😜) FILTER - Take data from your table and filter on a certain dimension. Results in spills vertically and horizaontally UNIQUE - Unique data set from table SORT - Does what you expect it to do. FILTER and SORT part of calc engine. SORTBY - Used in conjunction with RANDARRAY to randomly sort a list of values RANDARRAY - Good for Monte Carlo simulations. Random values by x rows and y columns. SEQUENCE - Generate a sequence of numbers from 1 to n SINGLE - Didn't cover in the video cellsarraysFormulasIntroductionparadigm shiftusersborderH8Excel
Dynamic array spill range
Ten Excel features you’ll wish you’d known earlier - THR1024
Ten Excel features you’ll wish you’d known earlier - THR1024
Notes
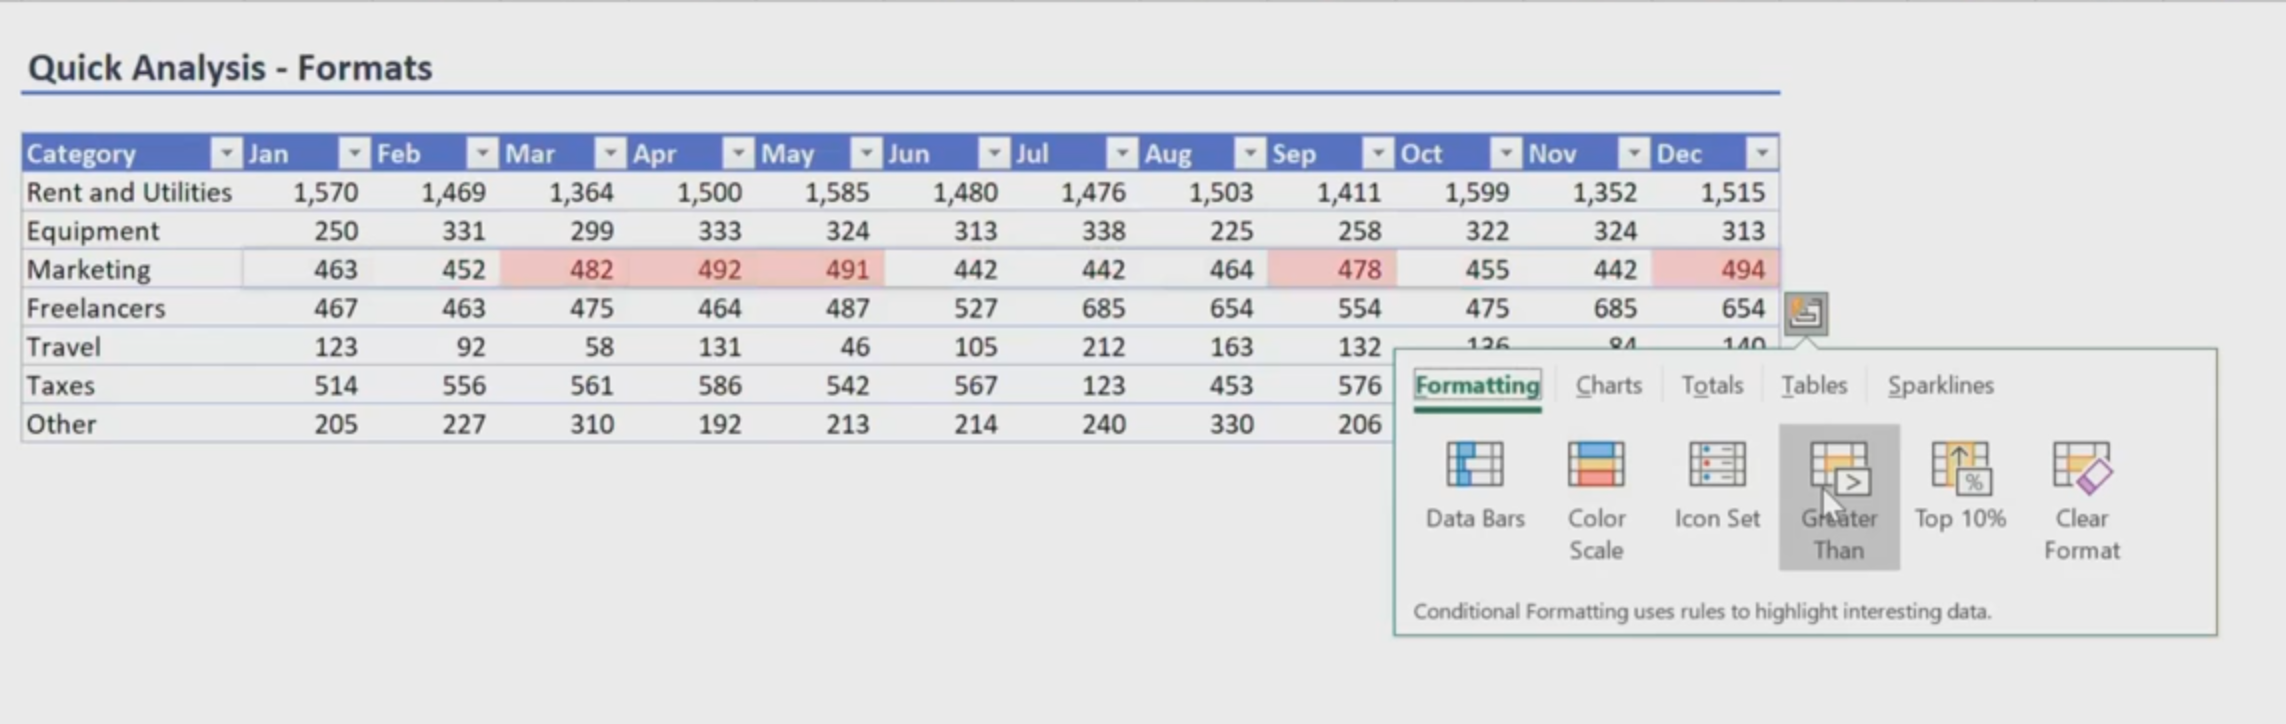
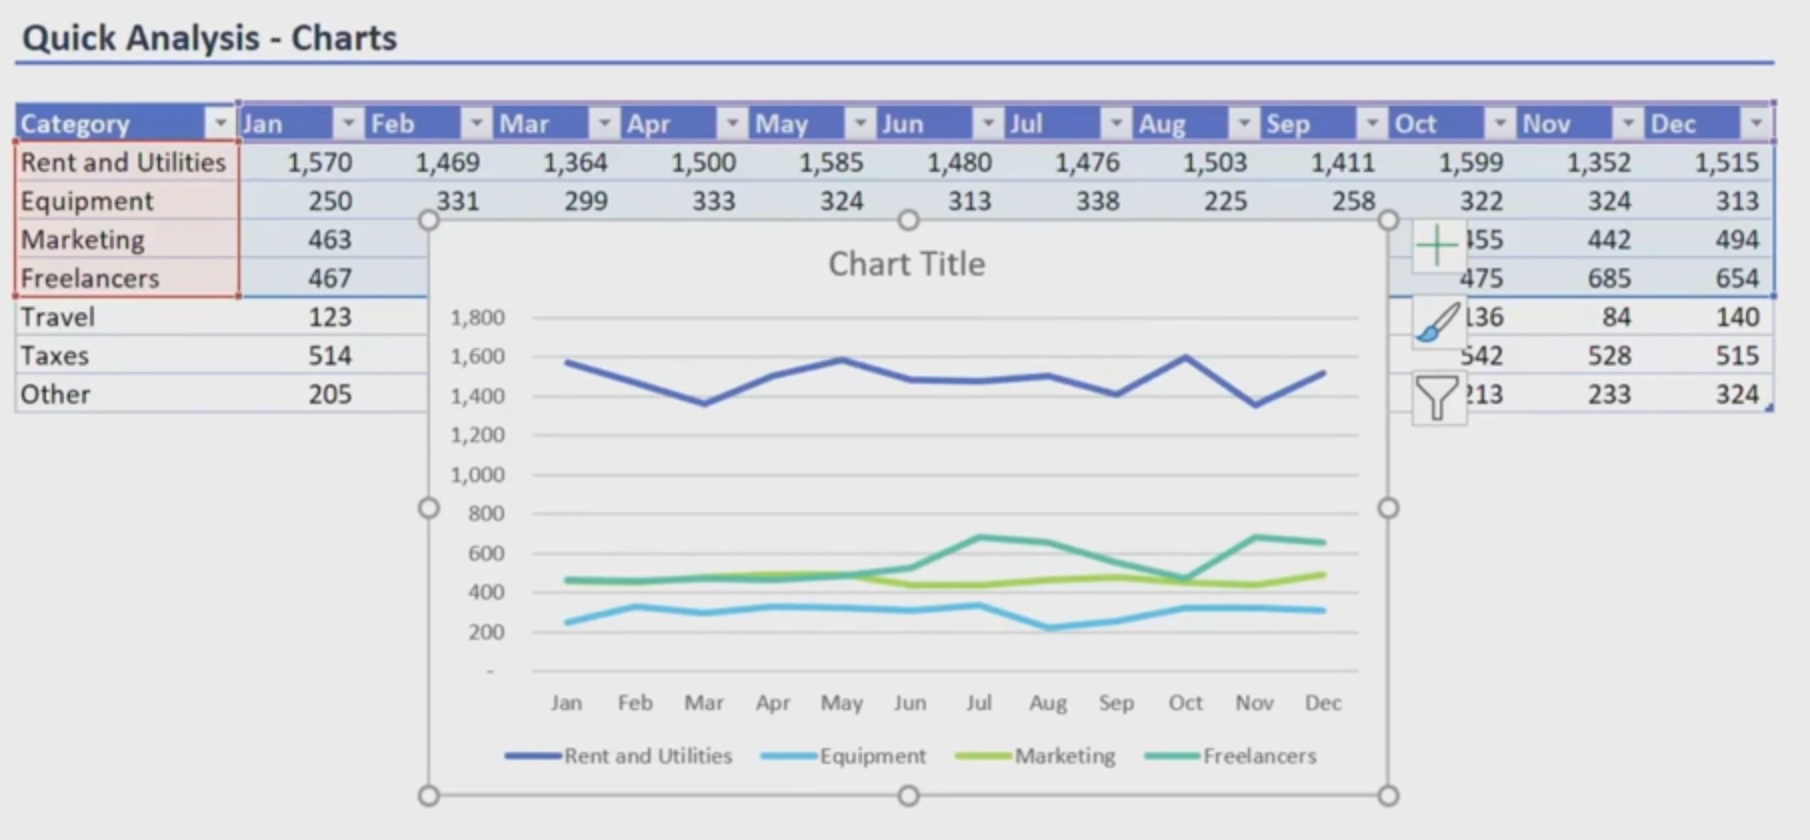
1) Quick Analysis - Hover over icons to quickly visualize trends in your data
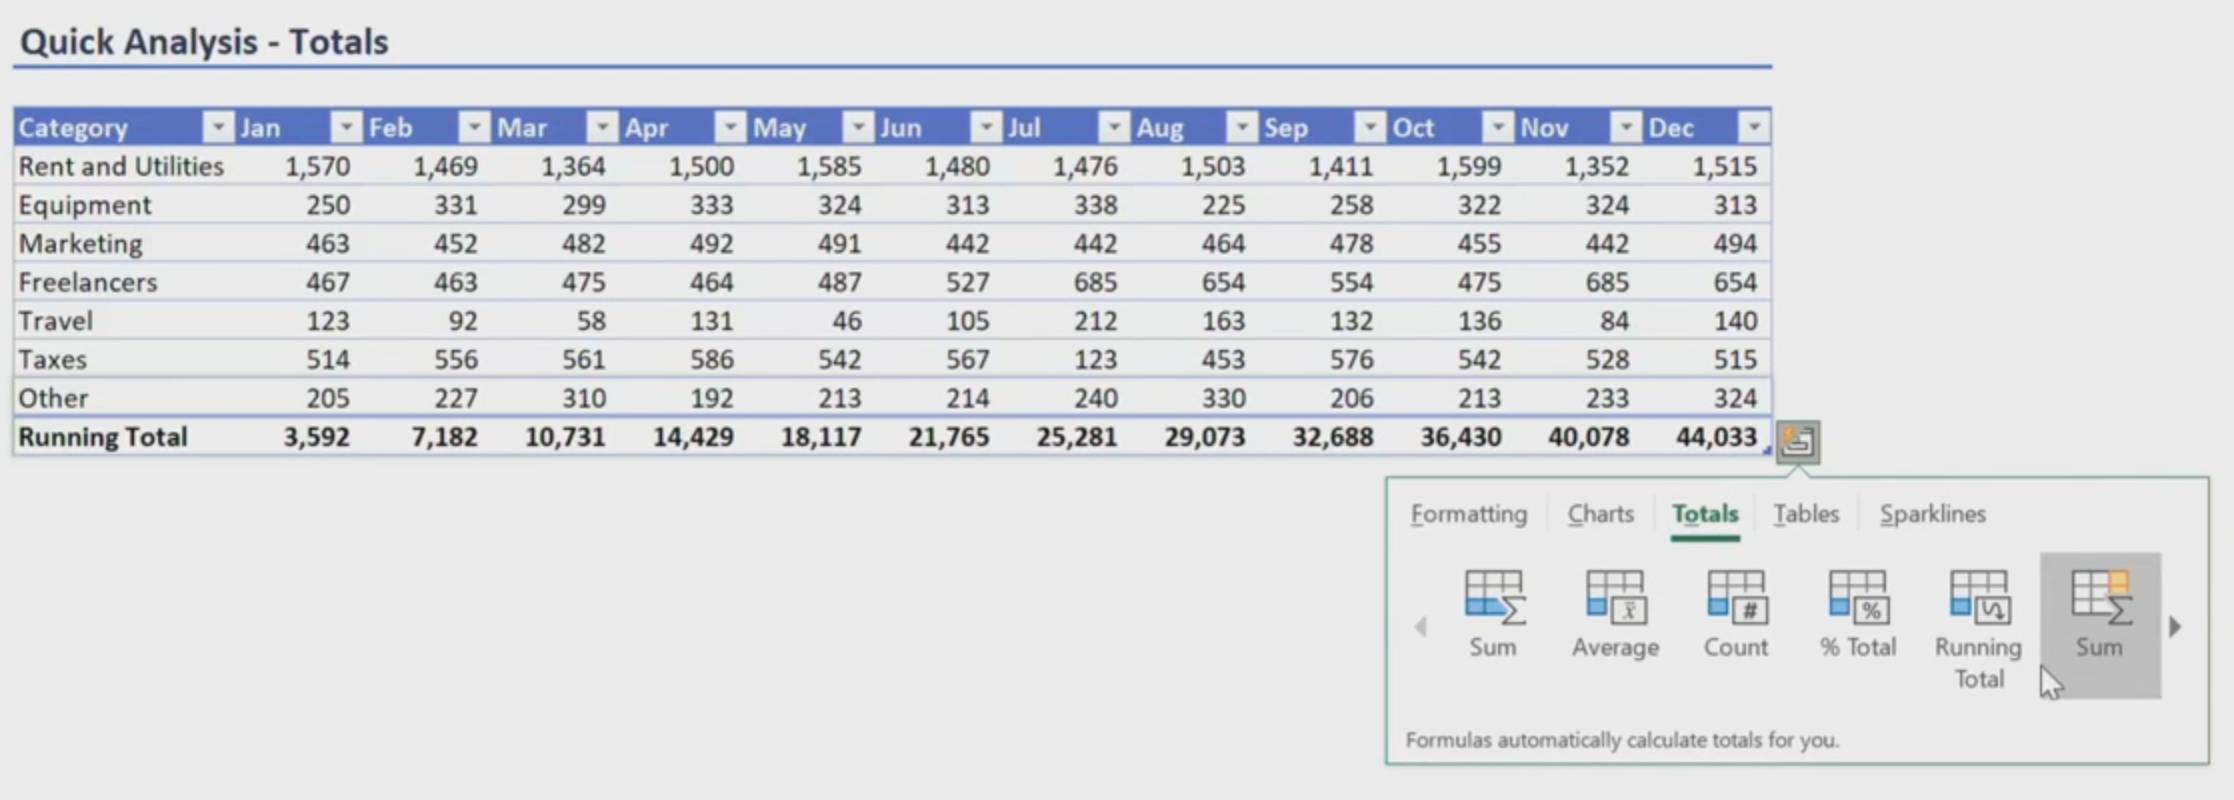
2) Quick Analysis Totals - Totals icon let's you get the total, average, count, etc. on the fly
3) Quick Analysis Charts - Looks like a lot of Quick Analysis here. Nothing crazy here, just throw in charts.
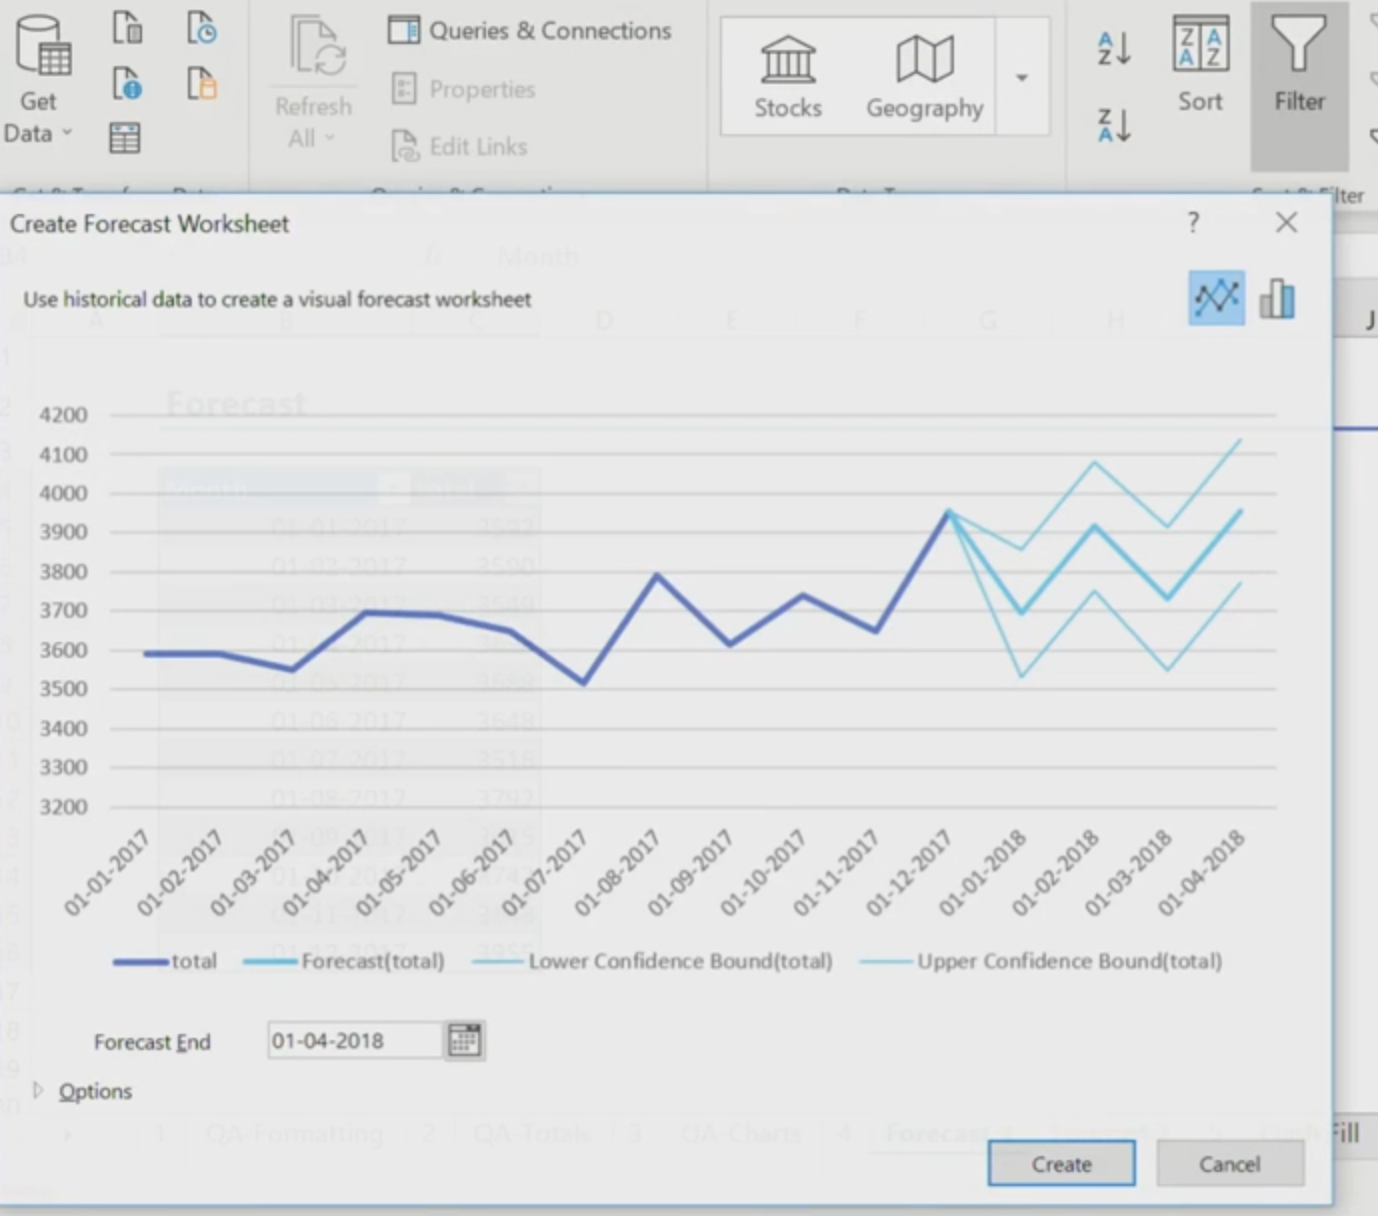
4) Forecast - Pretty neat button added to the Data > Forecast ribbon menu. Generates a quick and dirty forecast on the fly using the FORECAST function.
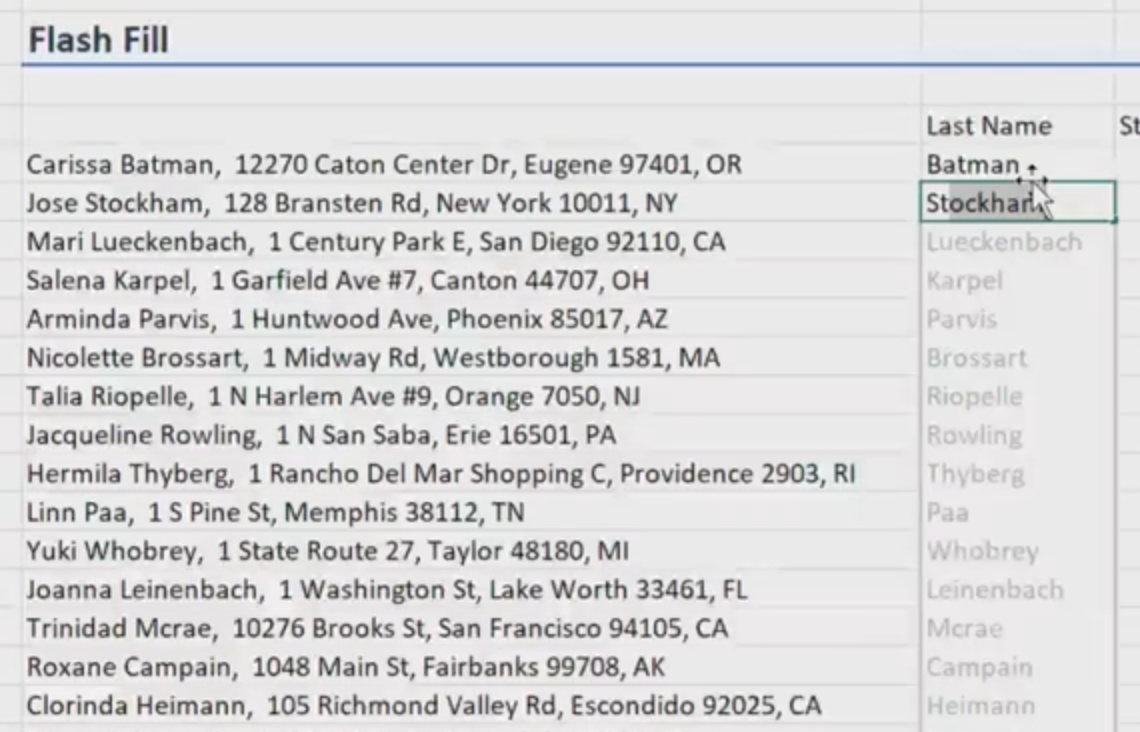
5) Flash Fill - As you start typing in a value to extract let's say the last name from a full name, Flash Fill detects what you are trying to do and fills it down for you.
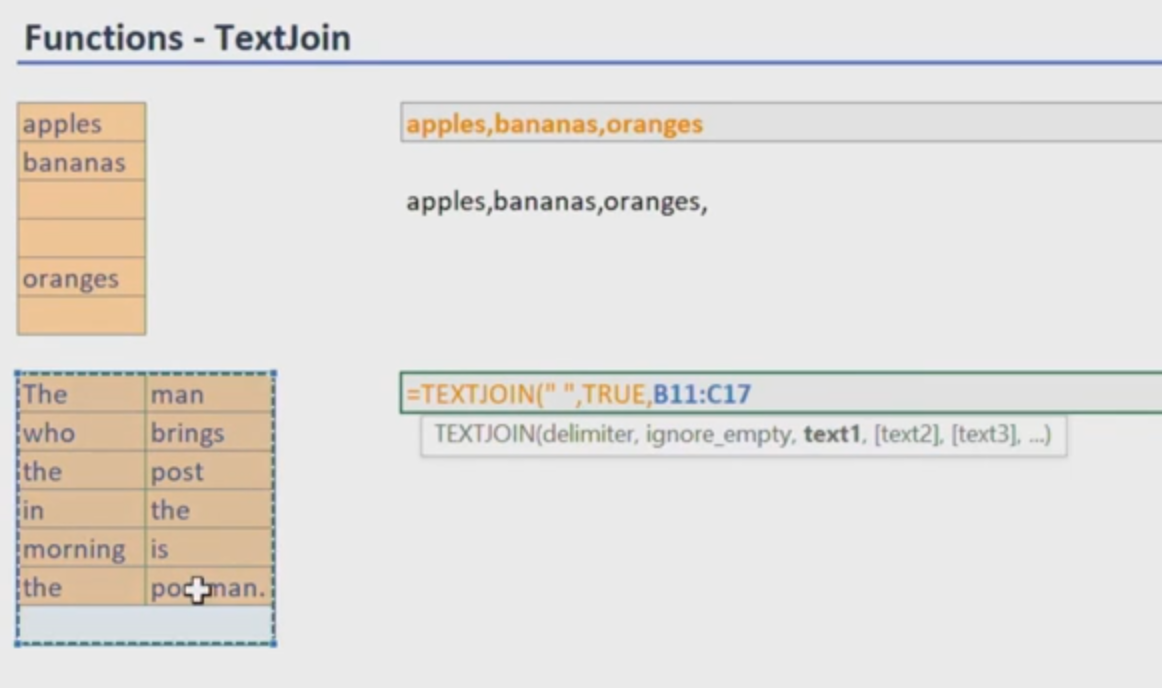
6) TextJoin - Pretty neat little function that let's you take a list of values and put it into a cell separated by a delimiter (e.g. comma, spaces, etc.)
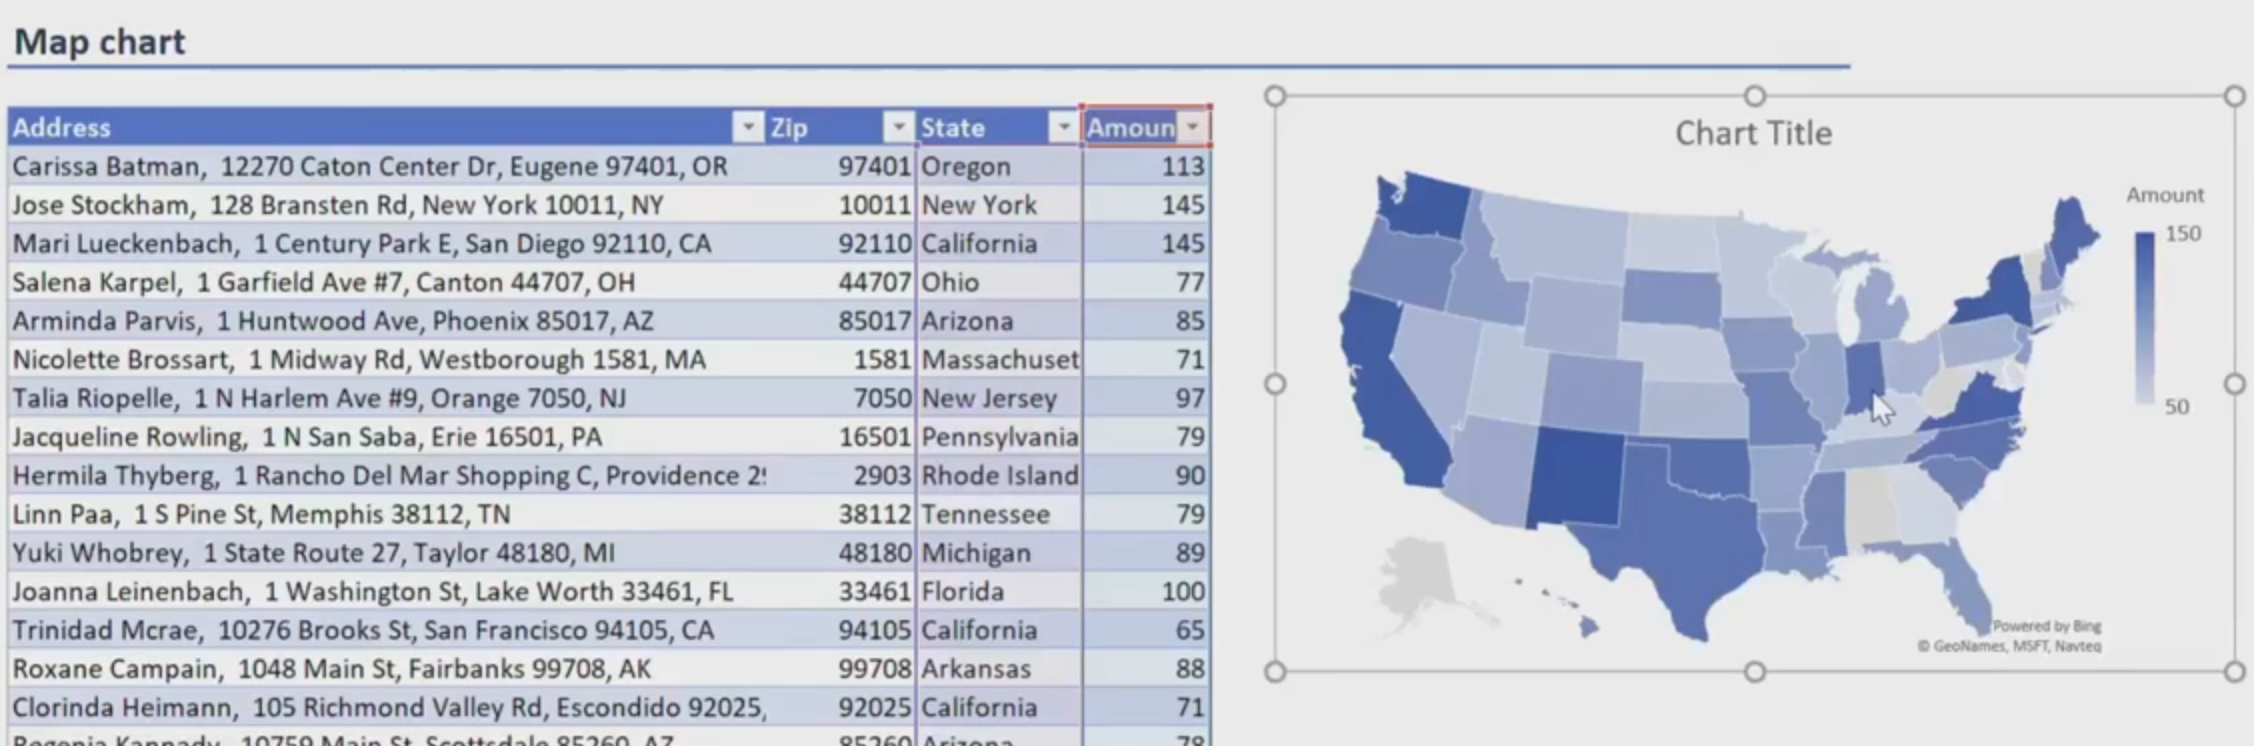
7) Map Chart - Interesting to see Excel considers a map a new type of "chart." A new button in the ribbon: Insert > Charts > Maps. If your data contains states/countries you can visualize the data on a map.
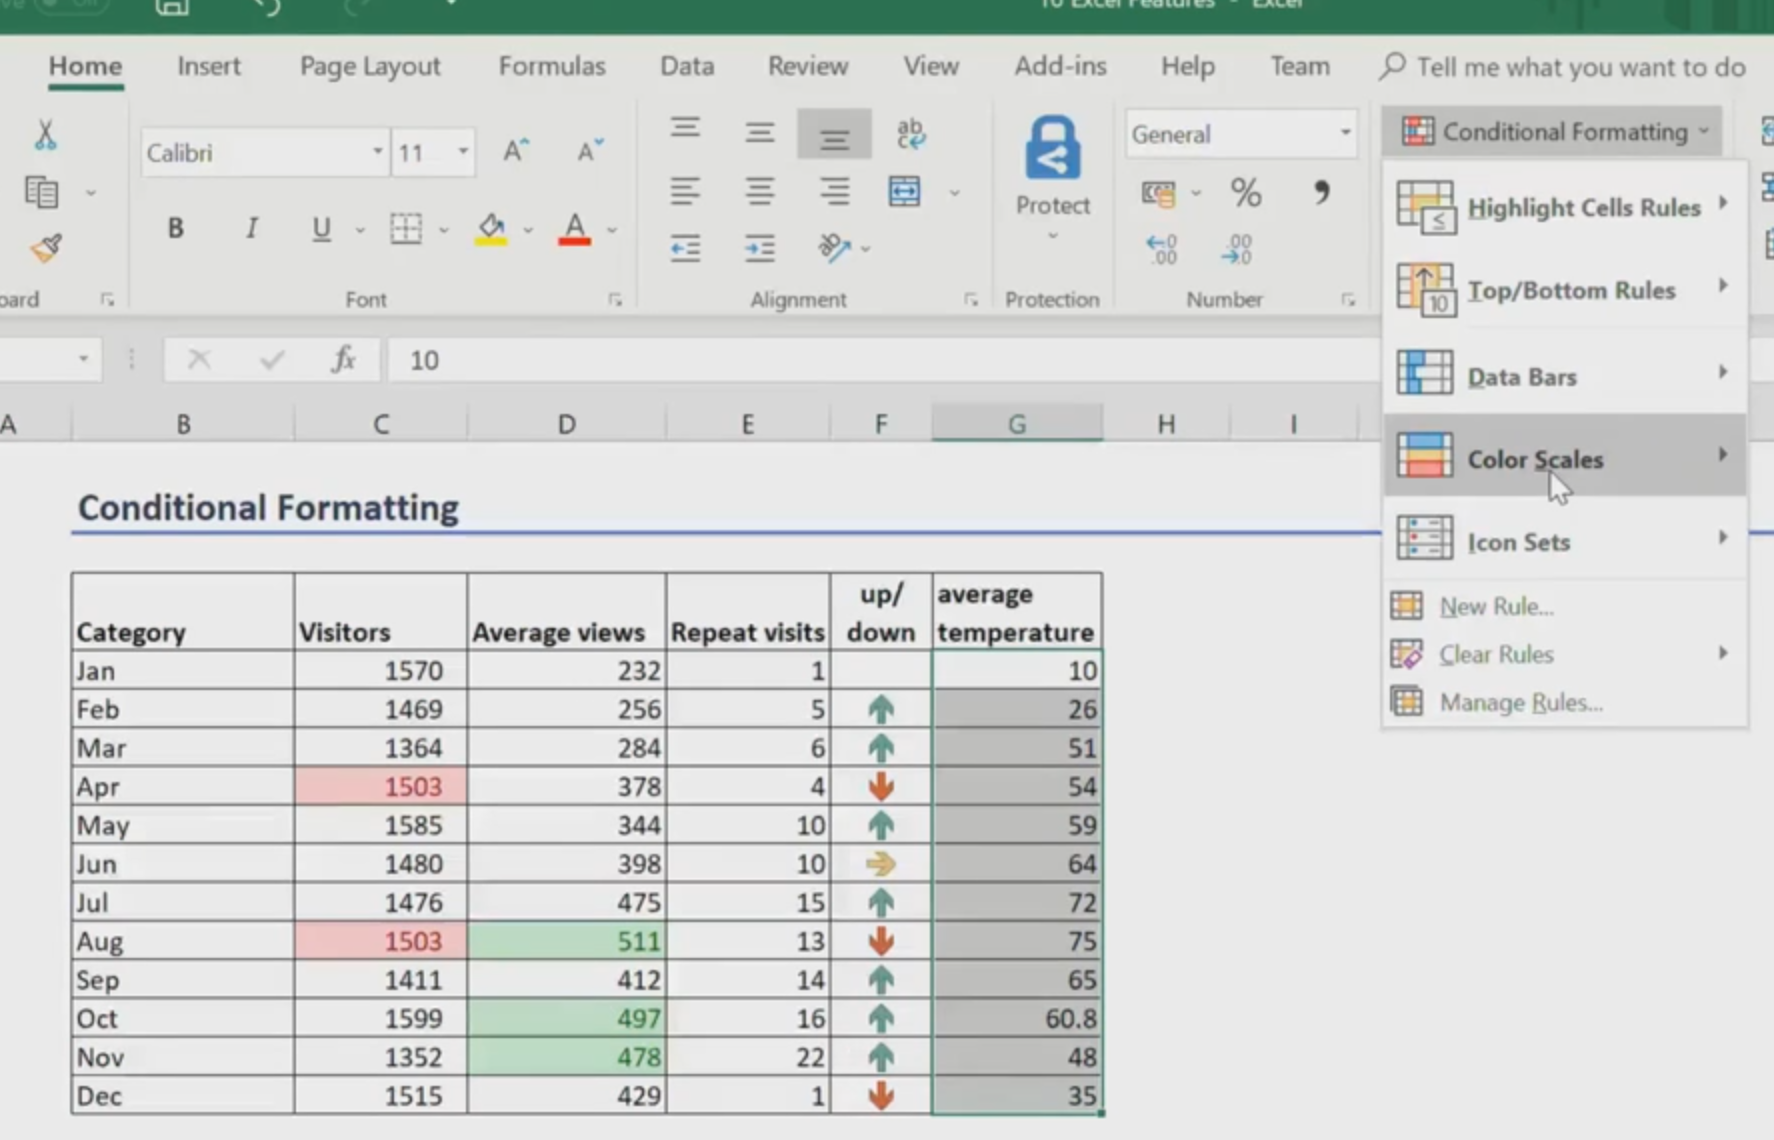
8) New ways to conditionally format - Not super interesting here, basically adds new ways to conditionally format your list of data. The icon sets are interesting since it let's you visualize your data as icons/emojis instead of numbers.
9) PivotTables - I'm guessing this session was targeted towards beginner/intermediate Excel users or they ran out of features to talk about? I thought they were going to talk about new features to PivotTables, but it was literally an explanation of how PivotTables work even though they've been around for 10+ years 🤔.
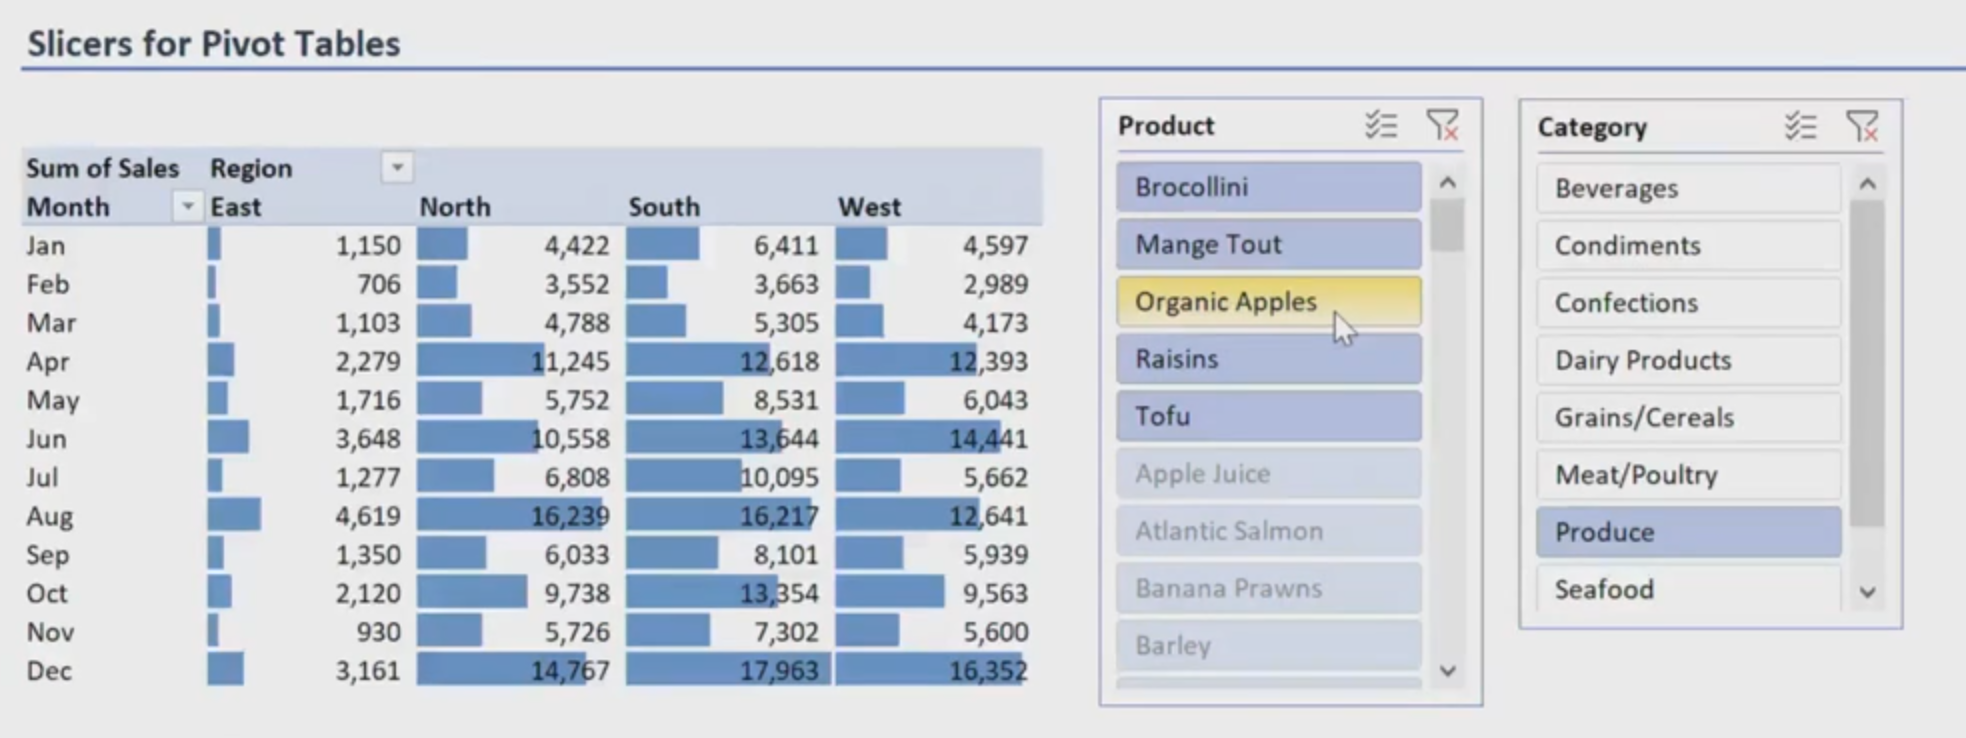
10) Slicers - "A filter on steroids." Just a quick way to get multiple filters on a data set. Good feature for filtering multiple charts along the same dimensions when you're working on a dashboard.
Power BI Excel and Office 365: Unlocking the Value of your Enterprise Data - BRK3252
Power BI Excel and Office 365: Unlocking the Value of your Enterprise Data - BRK3252
Notes
The obligatory data-driven quote to tee things up: "Customers want to gain business insights to make better data-driven decisions." 🙄 Lifecycle of crunching data to sharing analysis with your team: Excel → Power BI → Office 365 (e.g. Teams - Microsoft's version of Slack) Pretty cool to see your Excel files and Power BI reports inside of Teams If you see a chart from a Power BI report that you want to drill down into, you can open the source data model from the cloud inside Teams The Power BI report was created through Power Query Editor, feels like a more user-friendly version of writing macros As a data modeler, you have to know when seeing data in Power BI is better than Excel (and vice versa) → basically dependent on the number of rows of data Cleaning data in Power Query is similar to cleaning date in OpenRefine Bottom Line: If you are tied to a multi-year Microsoft license, makes sense to utilize all the tools in the ecosystem. Given modern ETL pipelines that rely on open-source tools, the Microsoft ETL ecosystem feels pretty closed and not interoperable with other platforms. MicrosoftExcel → Power BIquoteNotesCustomersthingsbusiness insightsdecisionsOffice 365
Be a data ninja: Best practices for analytics using Microsoft Excel - THR3017
Be a data ninja: Best practices for analytics using Microsoft Excel - THR3017
Notes
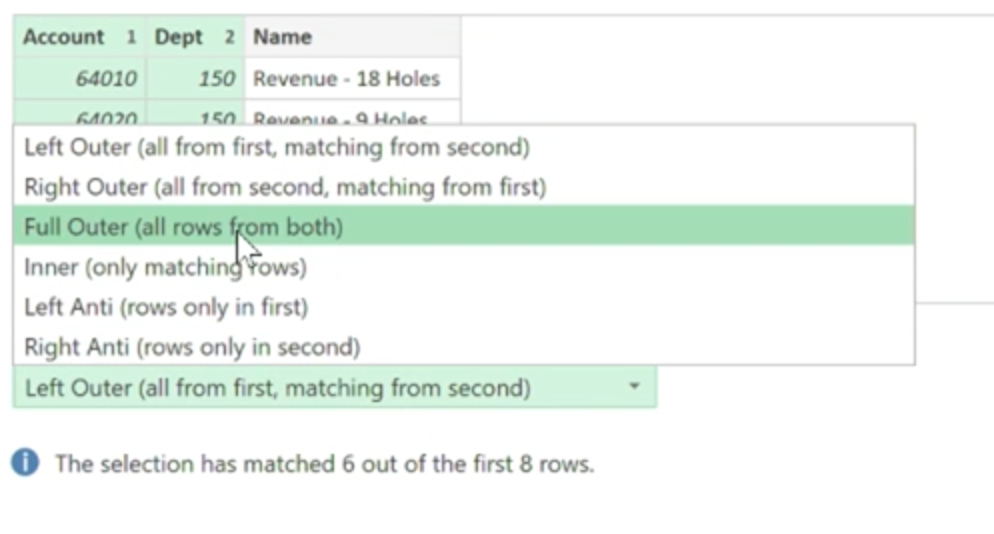
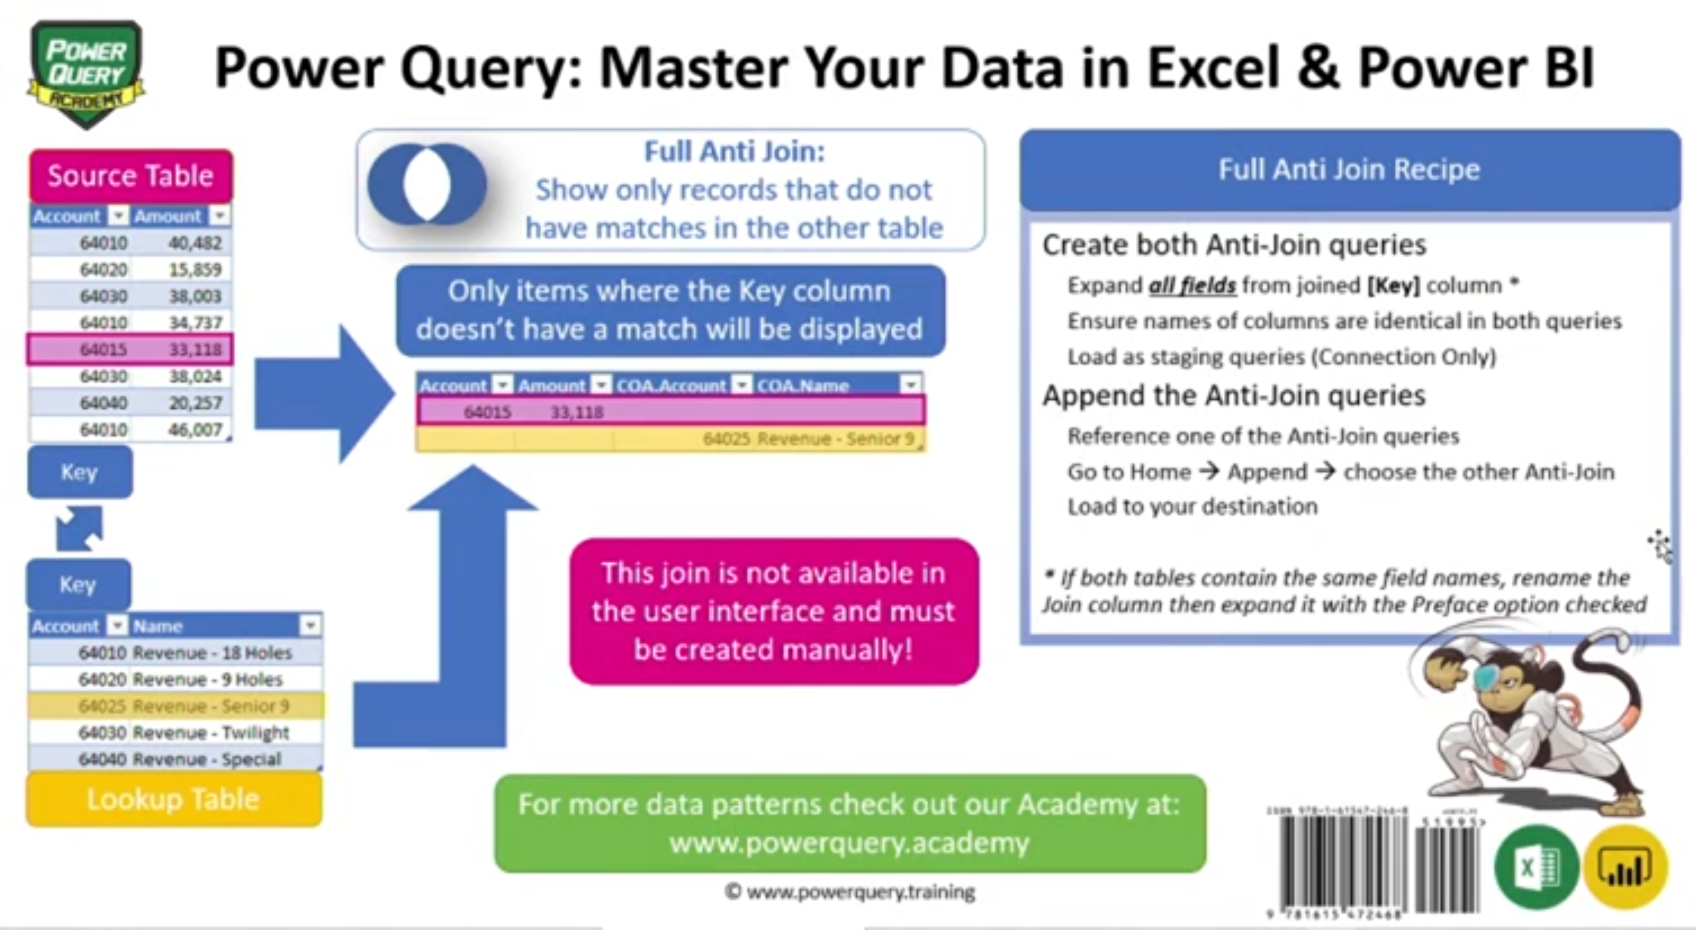
Good tip: "Keep data, calculations, and visualizations separate" → foundation for building any web app 👍 Questionable tip: "Bing is your friend: search and you will find." → I get it, it's a Microsoft conference Flash Fill definitely gets rid of the need to do text manipulation involving CONCATENATE, MID, FIND, LEFT, and RIGHT New data types have been hyped for some time which pulls external data from the Microsoft Knowledge Graph While pulling data into Power Query looks easy, there are multiple join types which can be confusing if you don't know SQL Once it's set up though it's a great substitute for VLOOKUP as it's much easier to reconcile data and find rows that don't match between two tables Probably makes sense when you have hundreds of thousands of rows. If it's a small dataset, Power Query is overkill The Dynamic Calendar Pattern is pretty neat where you use Power Query. Allows you to create a self-updating table instead of creating a static table where you're incrementing days one at a time with a formula Still a lot of data cleansing going on just to get a dynamic range of dates dataweb appPower QuerytipvisualizationscalculationsNotesfoundationSQL
Neat knowledge graph data
What's up with all these join types? Right Anti???
I think I would need to practice this a few times...
What's new in Microsoft Excel: Machine learning-powered insights new data types new - BRK2122
What's new in Microsoft Excel: Machine learning-powered insights new data types new - BRK2122
Notes
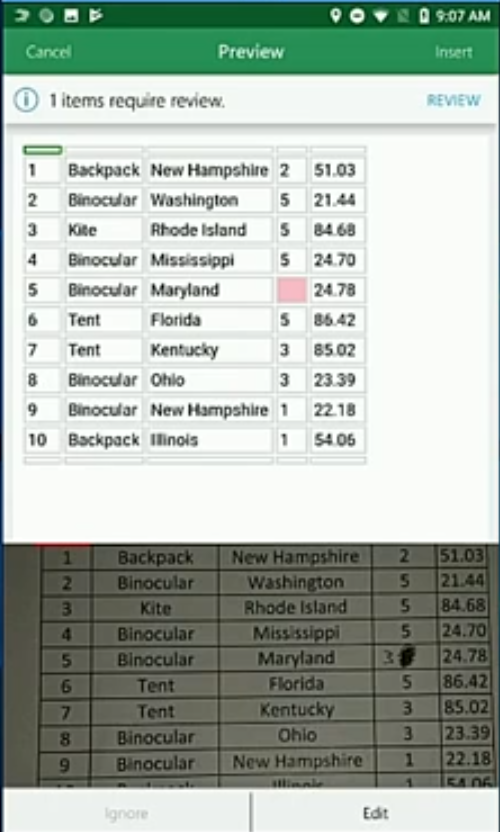
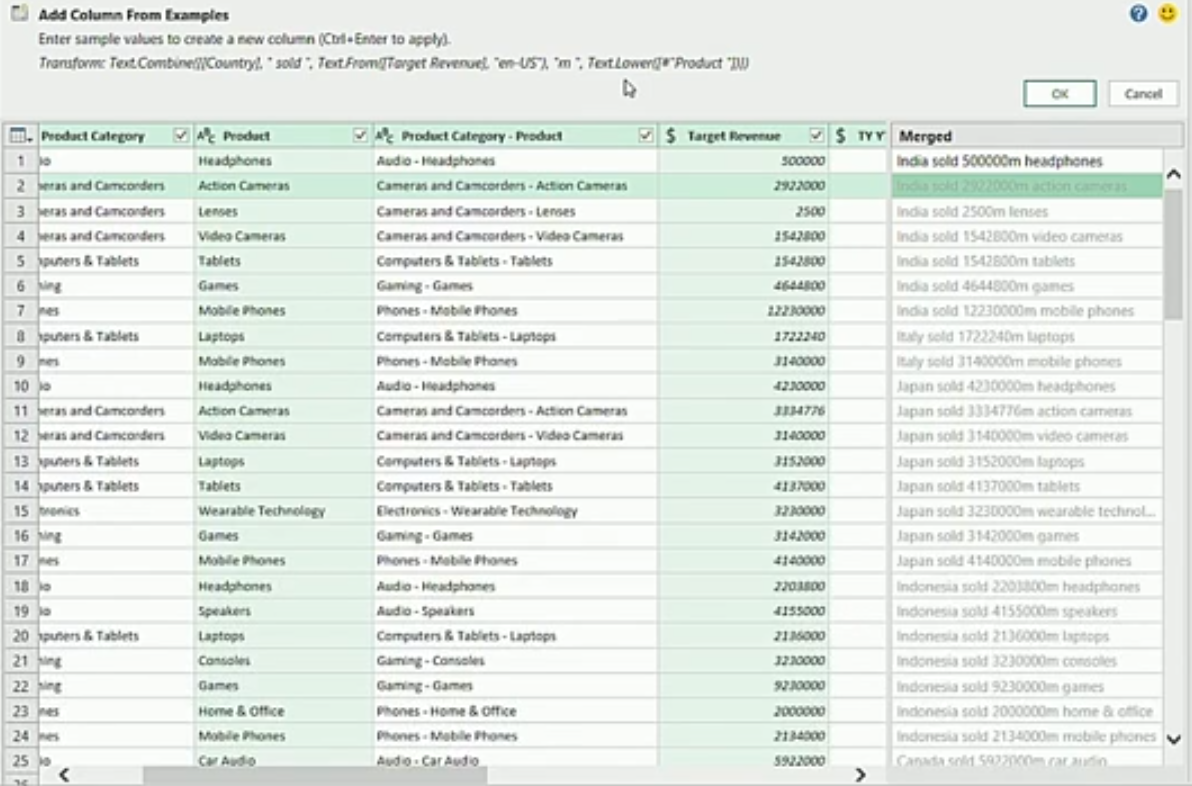
Excel is on 500 million devices worldwide each month, 1.5 billion file opes per day, 20,000 formula commits per second (!!!) Insert data from picture is a new paradigm where you don't do data entry, but rather fix data issues with the table returned from the picture (since it won't be perfect) Dynamic arrays actually reduce the file size since you're only writing one formula that is "spilled" to other cells No more dragging and filling down your formulas to the last row in your data set New data types are geography and stocks; performance on loading 500+ stock tickers was pretty fast! You just enter in the value like any other value but as long as Excel knows the cell is one of the new data types, Excel "converts" the value to a rich data type Pulling external data via "Get Data" from a 3rd-party has increased the number of connections including MySQL db, Postgres db, JSON, SAP HANA, etc. The "Transform" feature combined with Flash Fill makes it easy to create new columns of merged data for novices with the "Column from Example> in Power Query. You can then see the actual Flash Fill formula that results from the smart autofill Performance improvement on lookup formulas! Showed an example of a spreadsheet that would take ~9 minutes to calc with all the lookup formulas that got cut down to 3-4 seconds with the new version of Excel Made a comment about how the saved time leads to better energy savings overall Working on private views!!! Discussed the "strong GitHub integration" where you can put in the URL of GitHub link to get a custom function from the repo You can stream real-time data into Excel 😃, showed a video of an Office customer in the inventory tracking business showing data getting streamed into Excel Bottom Line: Transform and Flash Fill are probably the coolest features to help you cleanse your data and do some basic ETLing paradigmgeographyformuladataExceldata typesdata entryfilesecond
Take a picture of a table and it converts to a table in Excel!
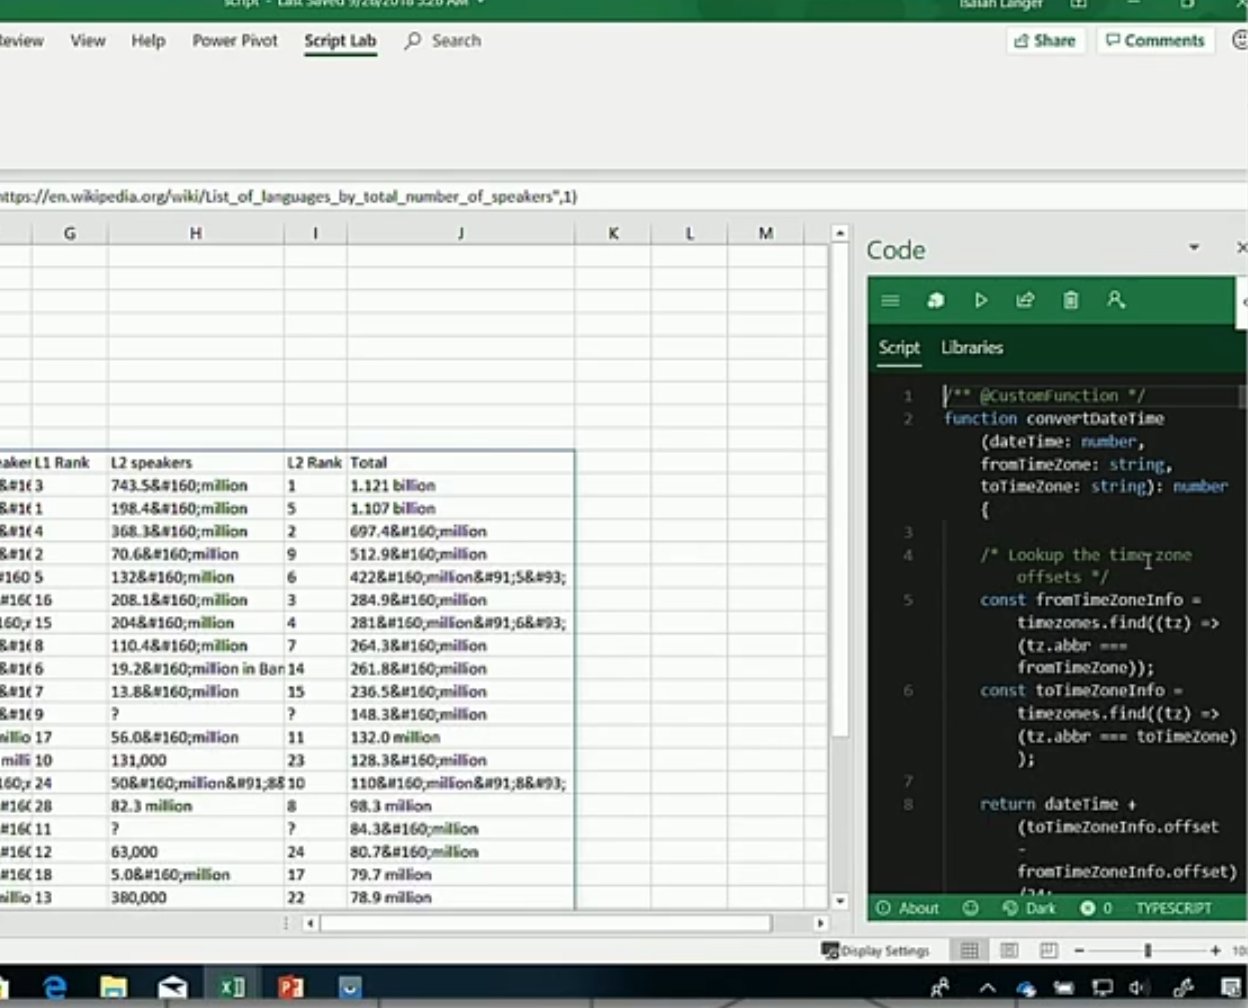
Transform + Flash Fill = 💲. You can see the results of the Flash Fill in the right-most merged column before you actually commit the formula. At the top of the screen, you can see the Transform formula that gets applied so you can learn about how the Flash Fill formula language works.
Get scripts from GitHub links
Advanced analytics in Microsoft Excel: Get deep insights from your data including - BRK3082
Advanced analytics in Microsoft Excel: Get deep insights from your data including - BRK3082
Notes
Really great point about tools adapting to humans instead of other way around; Today: Expect people to learn and adapt to software and tools Tomorrow: Expect software and tools to adapt to people, and accelerate their job to mastery Interesting question about new data types: what does it mean for two data types to be equal to each other? The ticker data type is an object consisting of key → value pairs When comparing two MSFT ticker objects together, for instance, you're comparing all values of the objects together Looks like the common pattern here is you'll need to constantly refresh your data to ensure you're not comparing old data with new Context for new data types is important for whether Excel will convert the value to a new data type Will Ideas make lives easier for analysts? Seems like this AI feature generates nice charts, but perhaps it will merely inspire analysts to create the charts they really want to create? Looks like formatting doesn't "spill" over with dynamic arrays, need to tweak your formatting around the "largest expected size" No more A1:A20-like reference with dynamic arrays, you need to start using the hashtag (#) ー funny that hashtags typically denote errors in Excel peopledata typestoolssoftwarepointNoteswayhumansticker data type
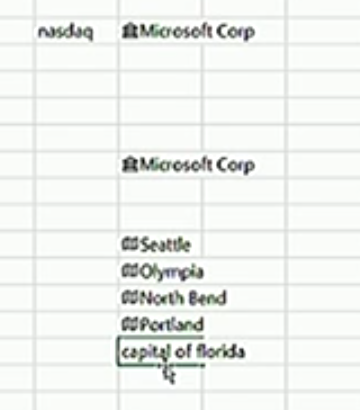
Context for new data types: Just having "nasdaq" near a value with "MSFT" means the MSFT value will automatically get converted to a ticker data type. Same goes for values you type near already created data types like cities.
 Notes
Notes