


Top 4 tips for implementing OKRs at your organization
Best practices for implementing OKRs.

The Coda team
Top 4 tips for implementing OKRs at your organization
By The Coda team
Share this article


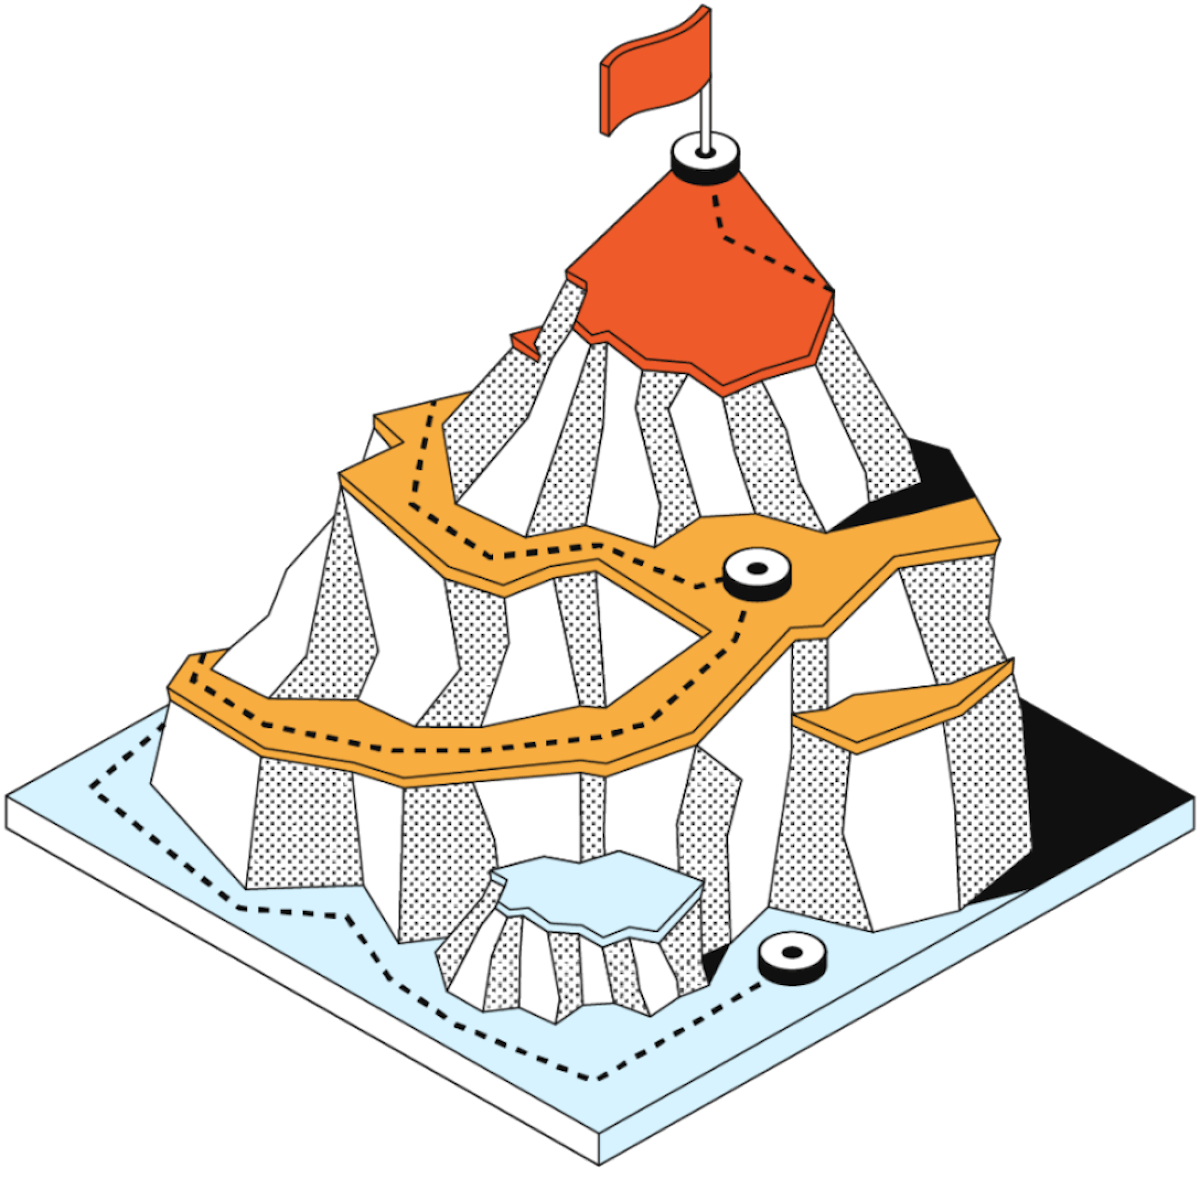
Keeping track of progress toward your OKRs serves as a motivating factor to achieve those goals while also uncovering which focus areas are falling short. With the right adaptation, an OKR methodology for planning and tracking are a natural extension of everything a team does—and the OKRs themselves serve as motivation for forward momentum. Coda makes the OKR process transparent via data visualizations, accessibility to other tools, and increasing visibility to progress with dashboards. At Coda, our central OKR docs are generally inserted into the staples of everyone’s schedule with Cross-doc, including one-on-one and team meetings. We keep them straightforward with a template that consists of two connected tables that measure progress on both objectives and key results.

Measuring progress of OKRs.

