
Estimating the climate impact of an annual Mill Membership
Estimating the climate impact of an annual Mill Membership
Background
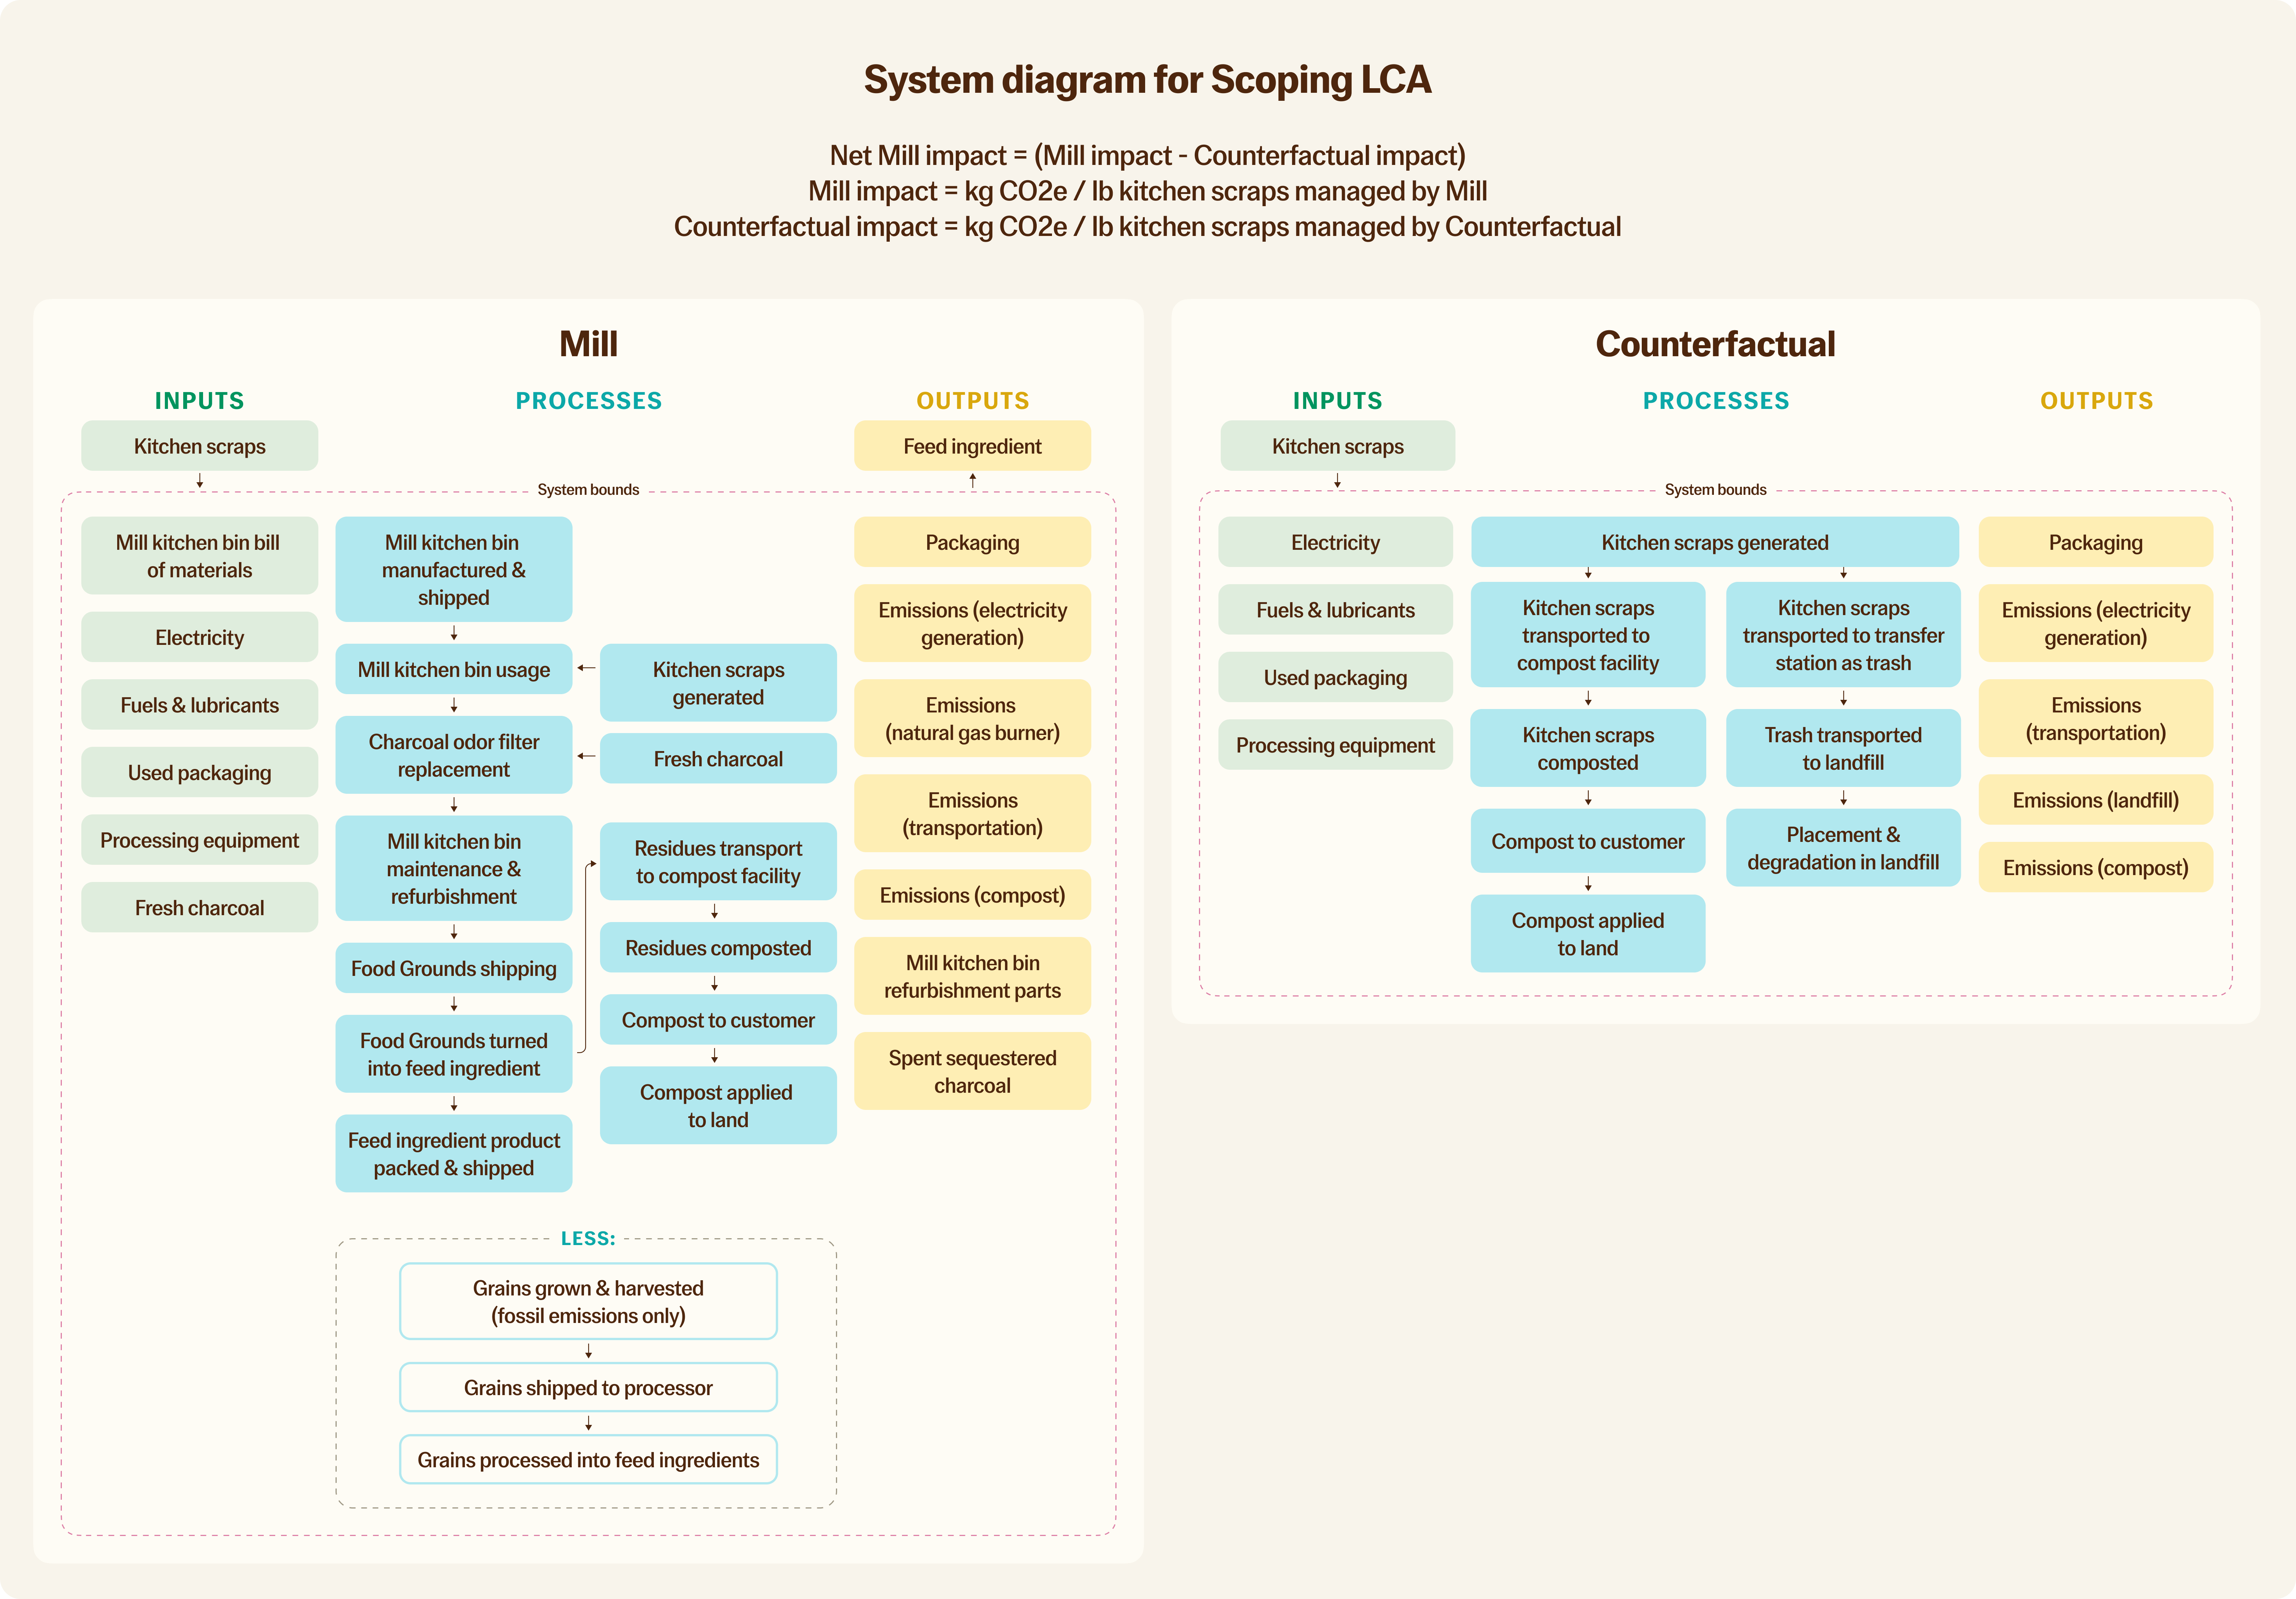
the global warming potential of carbon dioxide over a 20-year period.Scoping LCA
External validation
Approach
1
Scenario
Operations
Assumptions
2
Scenario 1
Near-term
Conservative
3
Scenario 2
Near-term
Optimistic
4
Scenario 3
Long-term
Conservative
5
Scenario 4
Long-term
Optimistic
There are no rows in this table
Considerations
Findings
1
Operations
Assumptions
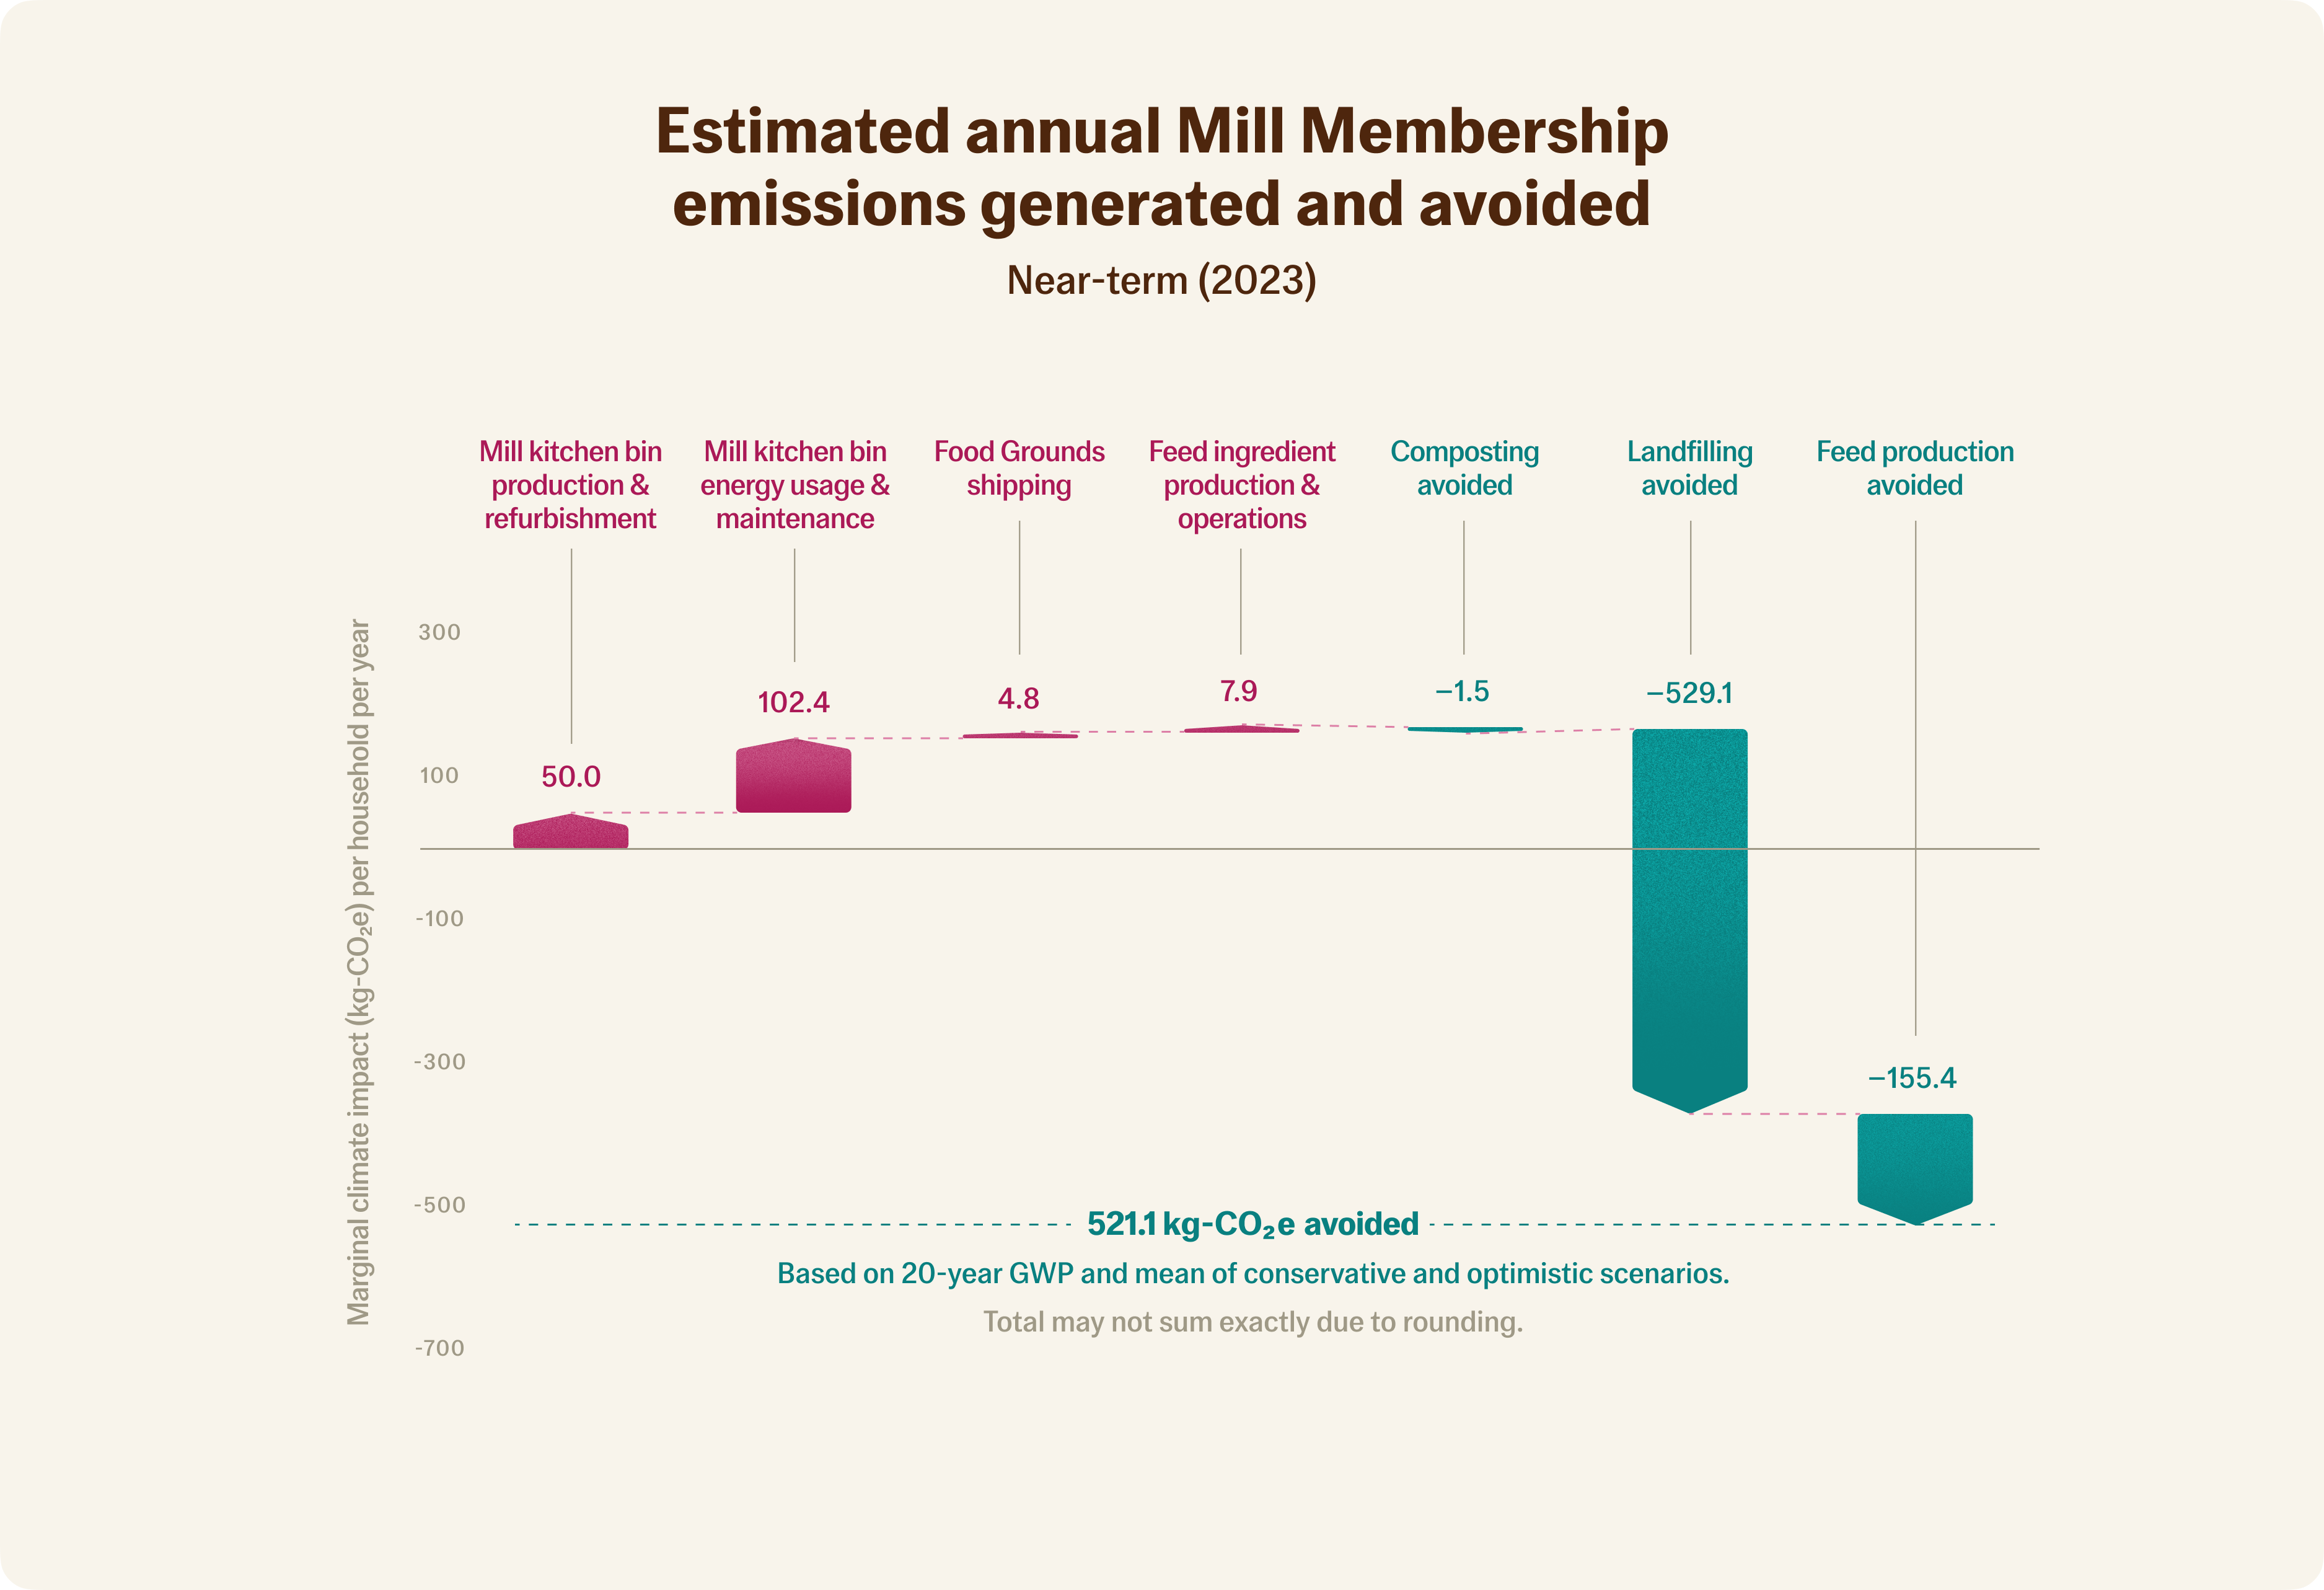
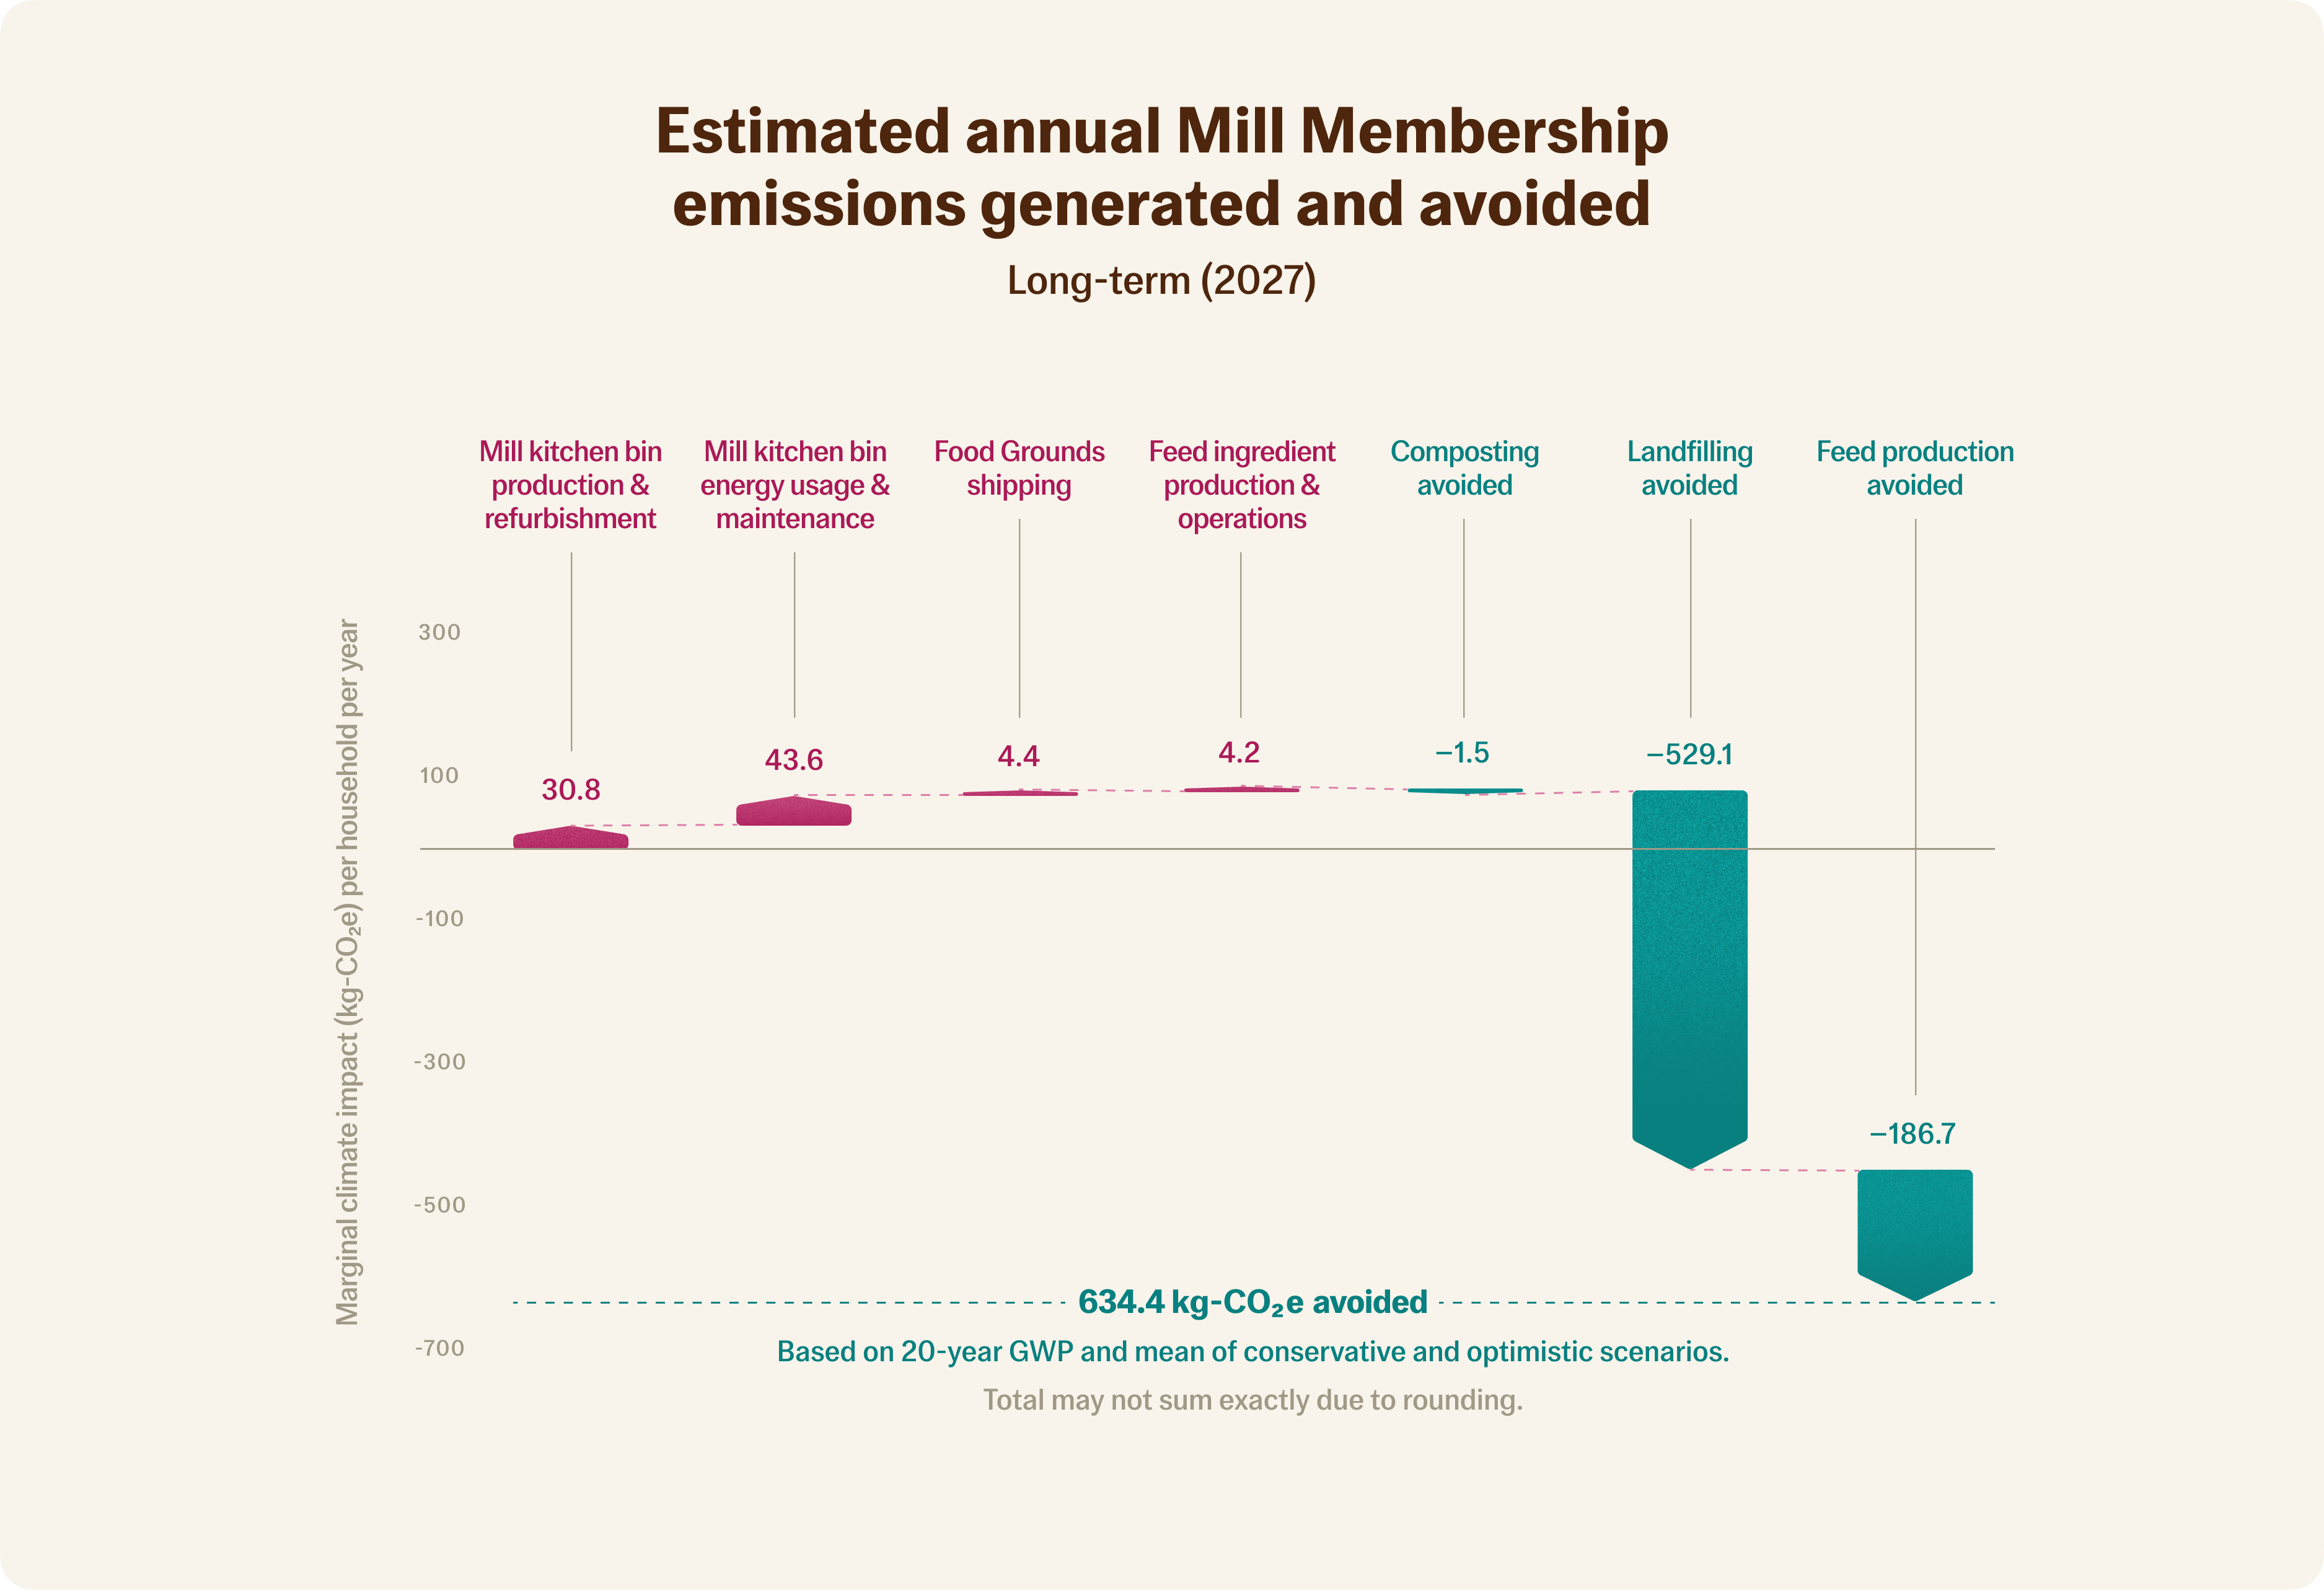
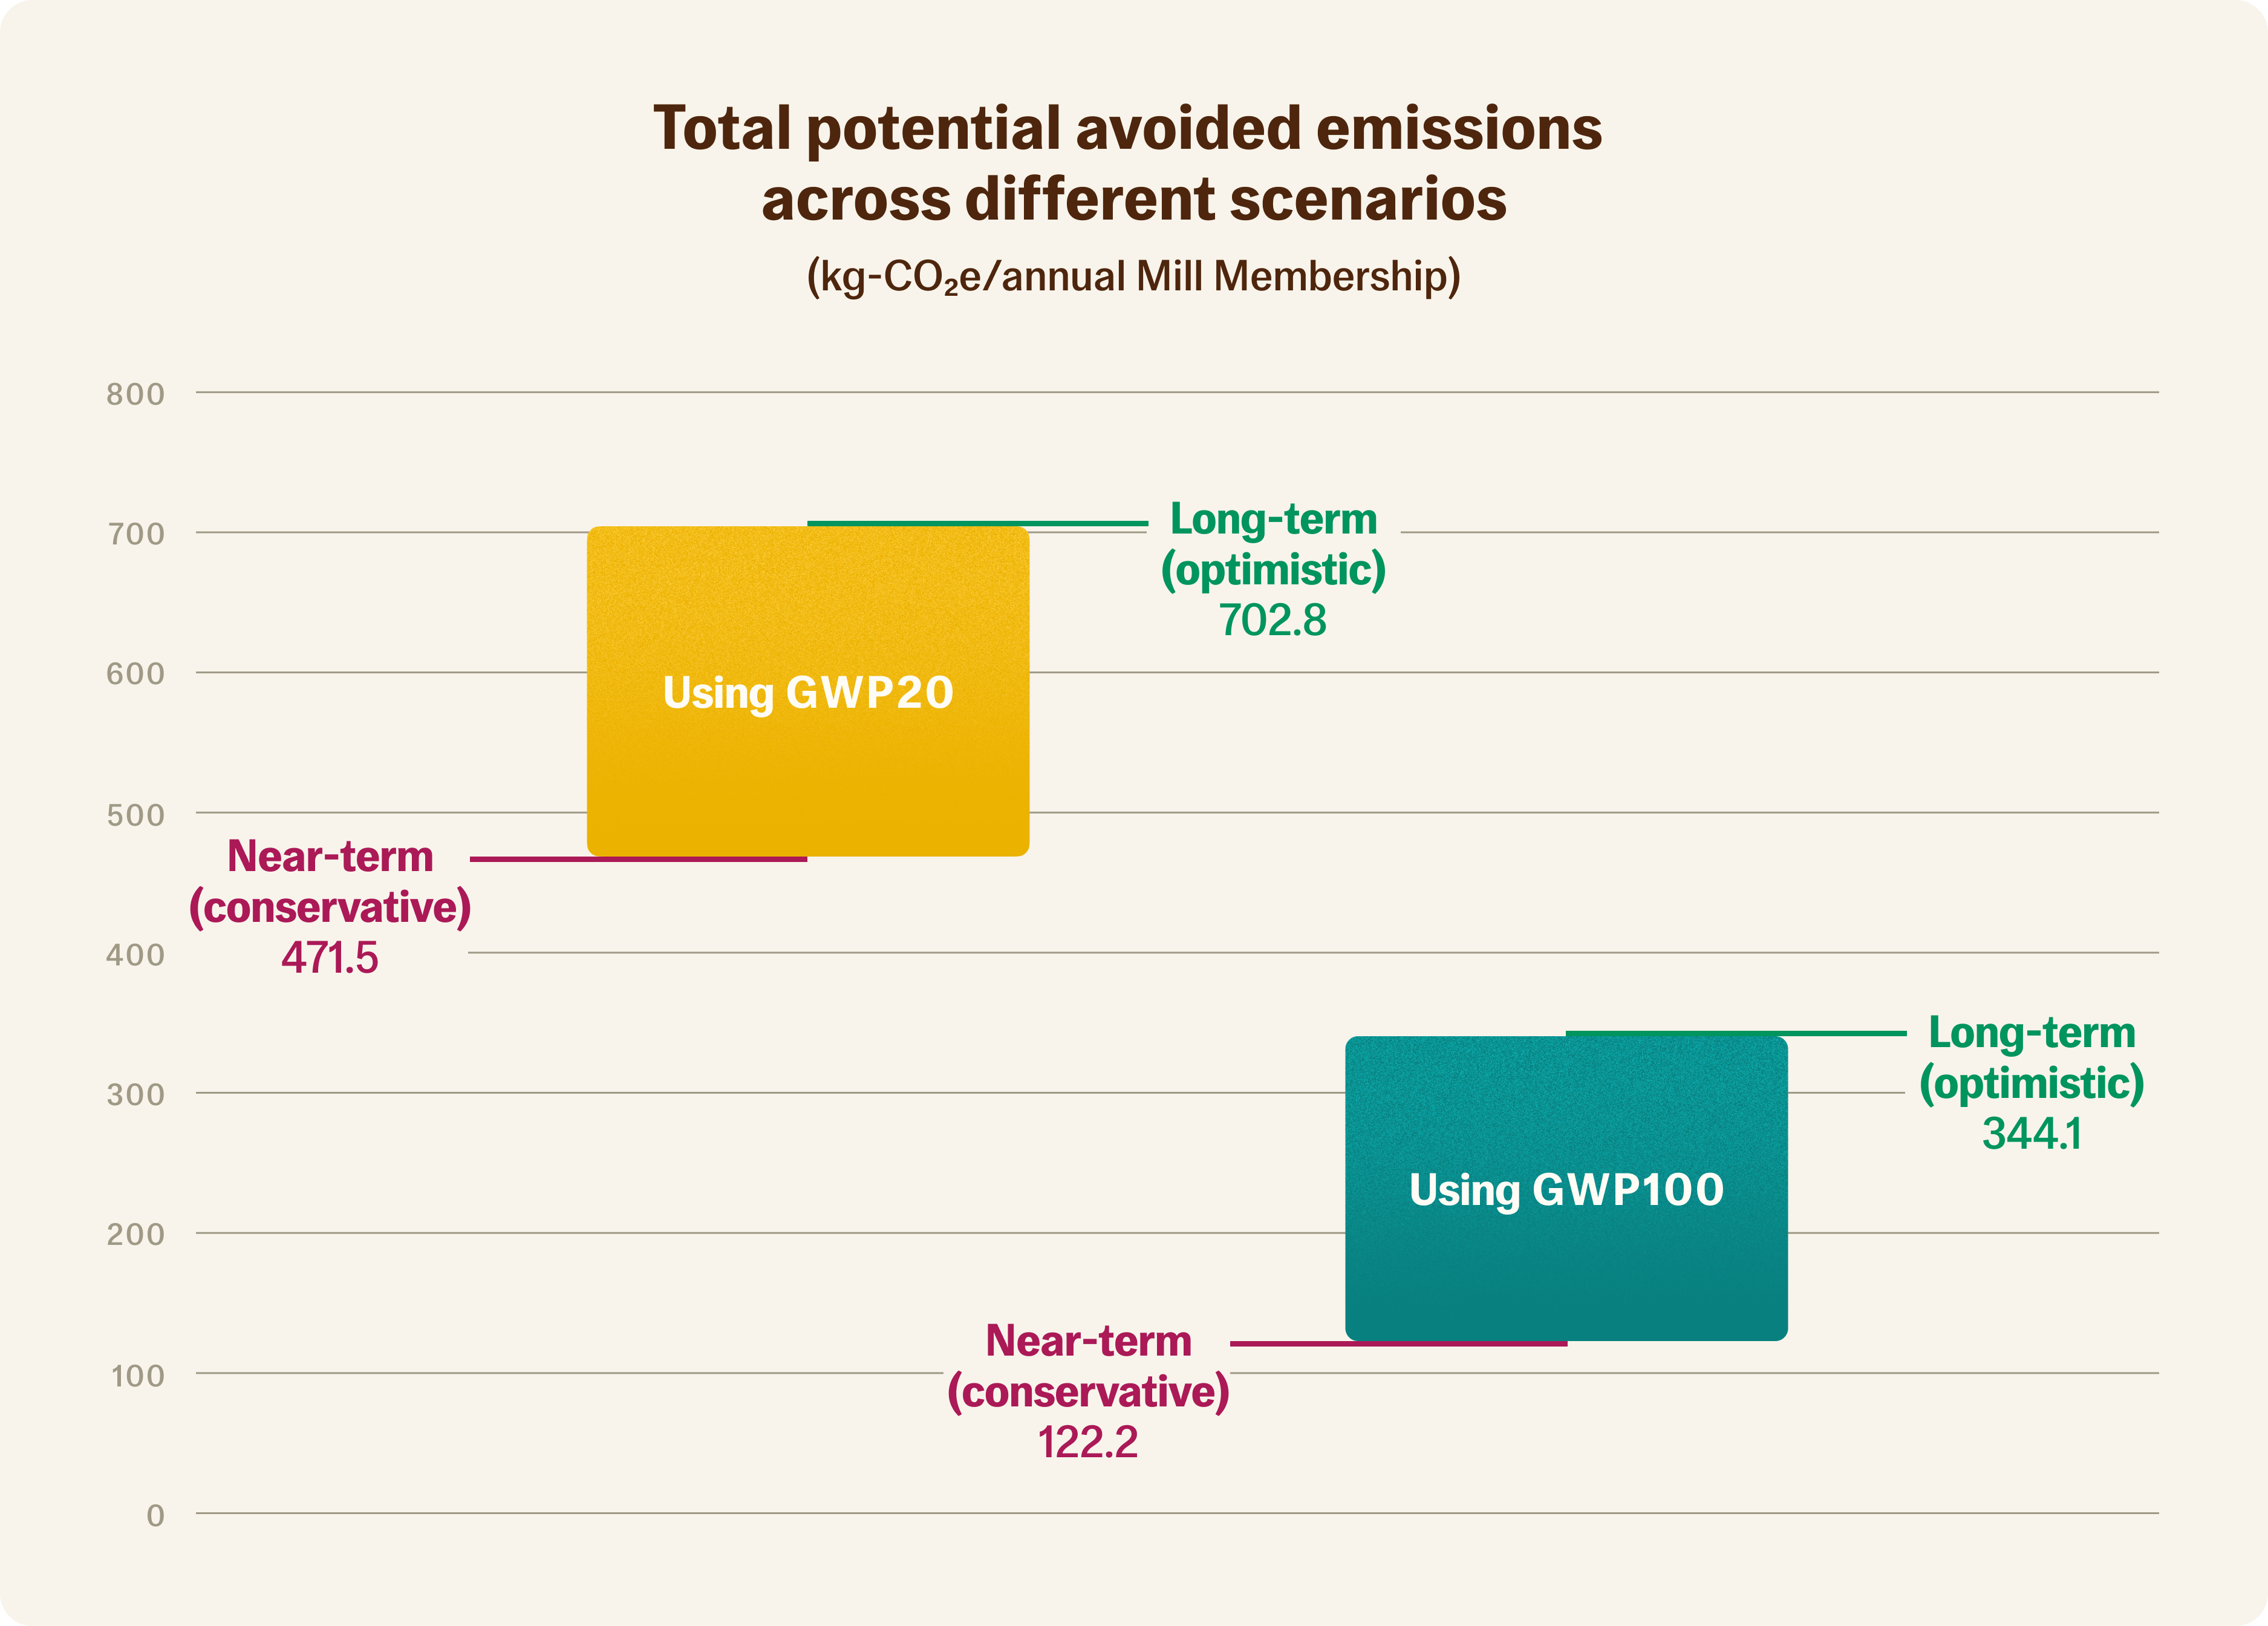
Avoided emissions (kg-CO2e per annual Mill Membership) using GWP20
2
Near-term
Conservative
471.5
3
Near-term
Optimistic
570.6
4
Near-term
Mean
521.1
5
Long-term
Conservative
565.9
6
Long-term
Optimistic
702.8
7
Long-term
Mean
634.4
There are no rows in this table
Future opportunities
Technical appendix
Phased approach
Exclusions
Key assumptions
1
Parameter
Near-term (2023) conservative
Near-term (2023) optimistic
Long-term (2027) conservative
Long-term (2027) optimistic
2
Device electricity use (long-term rolling mean, kWh/day)
0.852
(from field trial data)
0.75
(2023 target)
0.75
0.5
(2027 target)
There are no rows in this table
) because it assumes an aggressive approach to achieve a clean energy transition. We used different values for our two long-term scenarios because of significant uncertainty in the future U.S. grid mix.1
Parameter
Near-term (2023) conservative
Near-term (2023) optimistic
Long-term (2027) conservative
Long-term (2027) optimistic
2
Electric grid mix emission factor (kg-CO2e/kWh)
0.388
(U.S. 2021 mean)
0.388
(U.S. 2021 mean)
0.306
(EIA 2027 forecast)
0.138
(IEA 2027 forecast)
There are no rows in this table
1
Parameter
Value (constant across all scenarios)
2
Moisture content of kitchen scraps
72.2%
3
Carbon content of kitchen scraps
49.5%
4
Kitchen scraps-carbon to methane-carbon conversion yield
42%
5
Mass methane-C to mass methane
1.34
6
Landfill gas collection efficiency, national average for kitchen scraps
52%
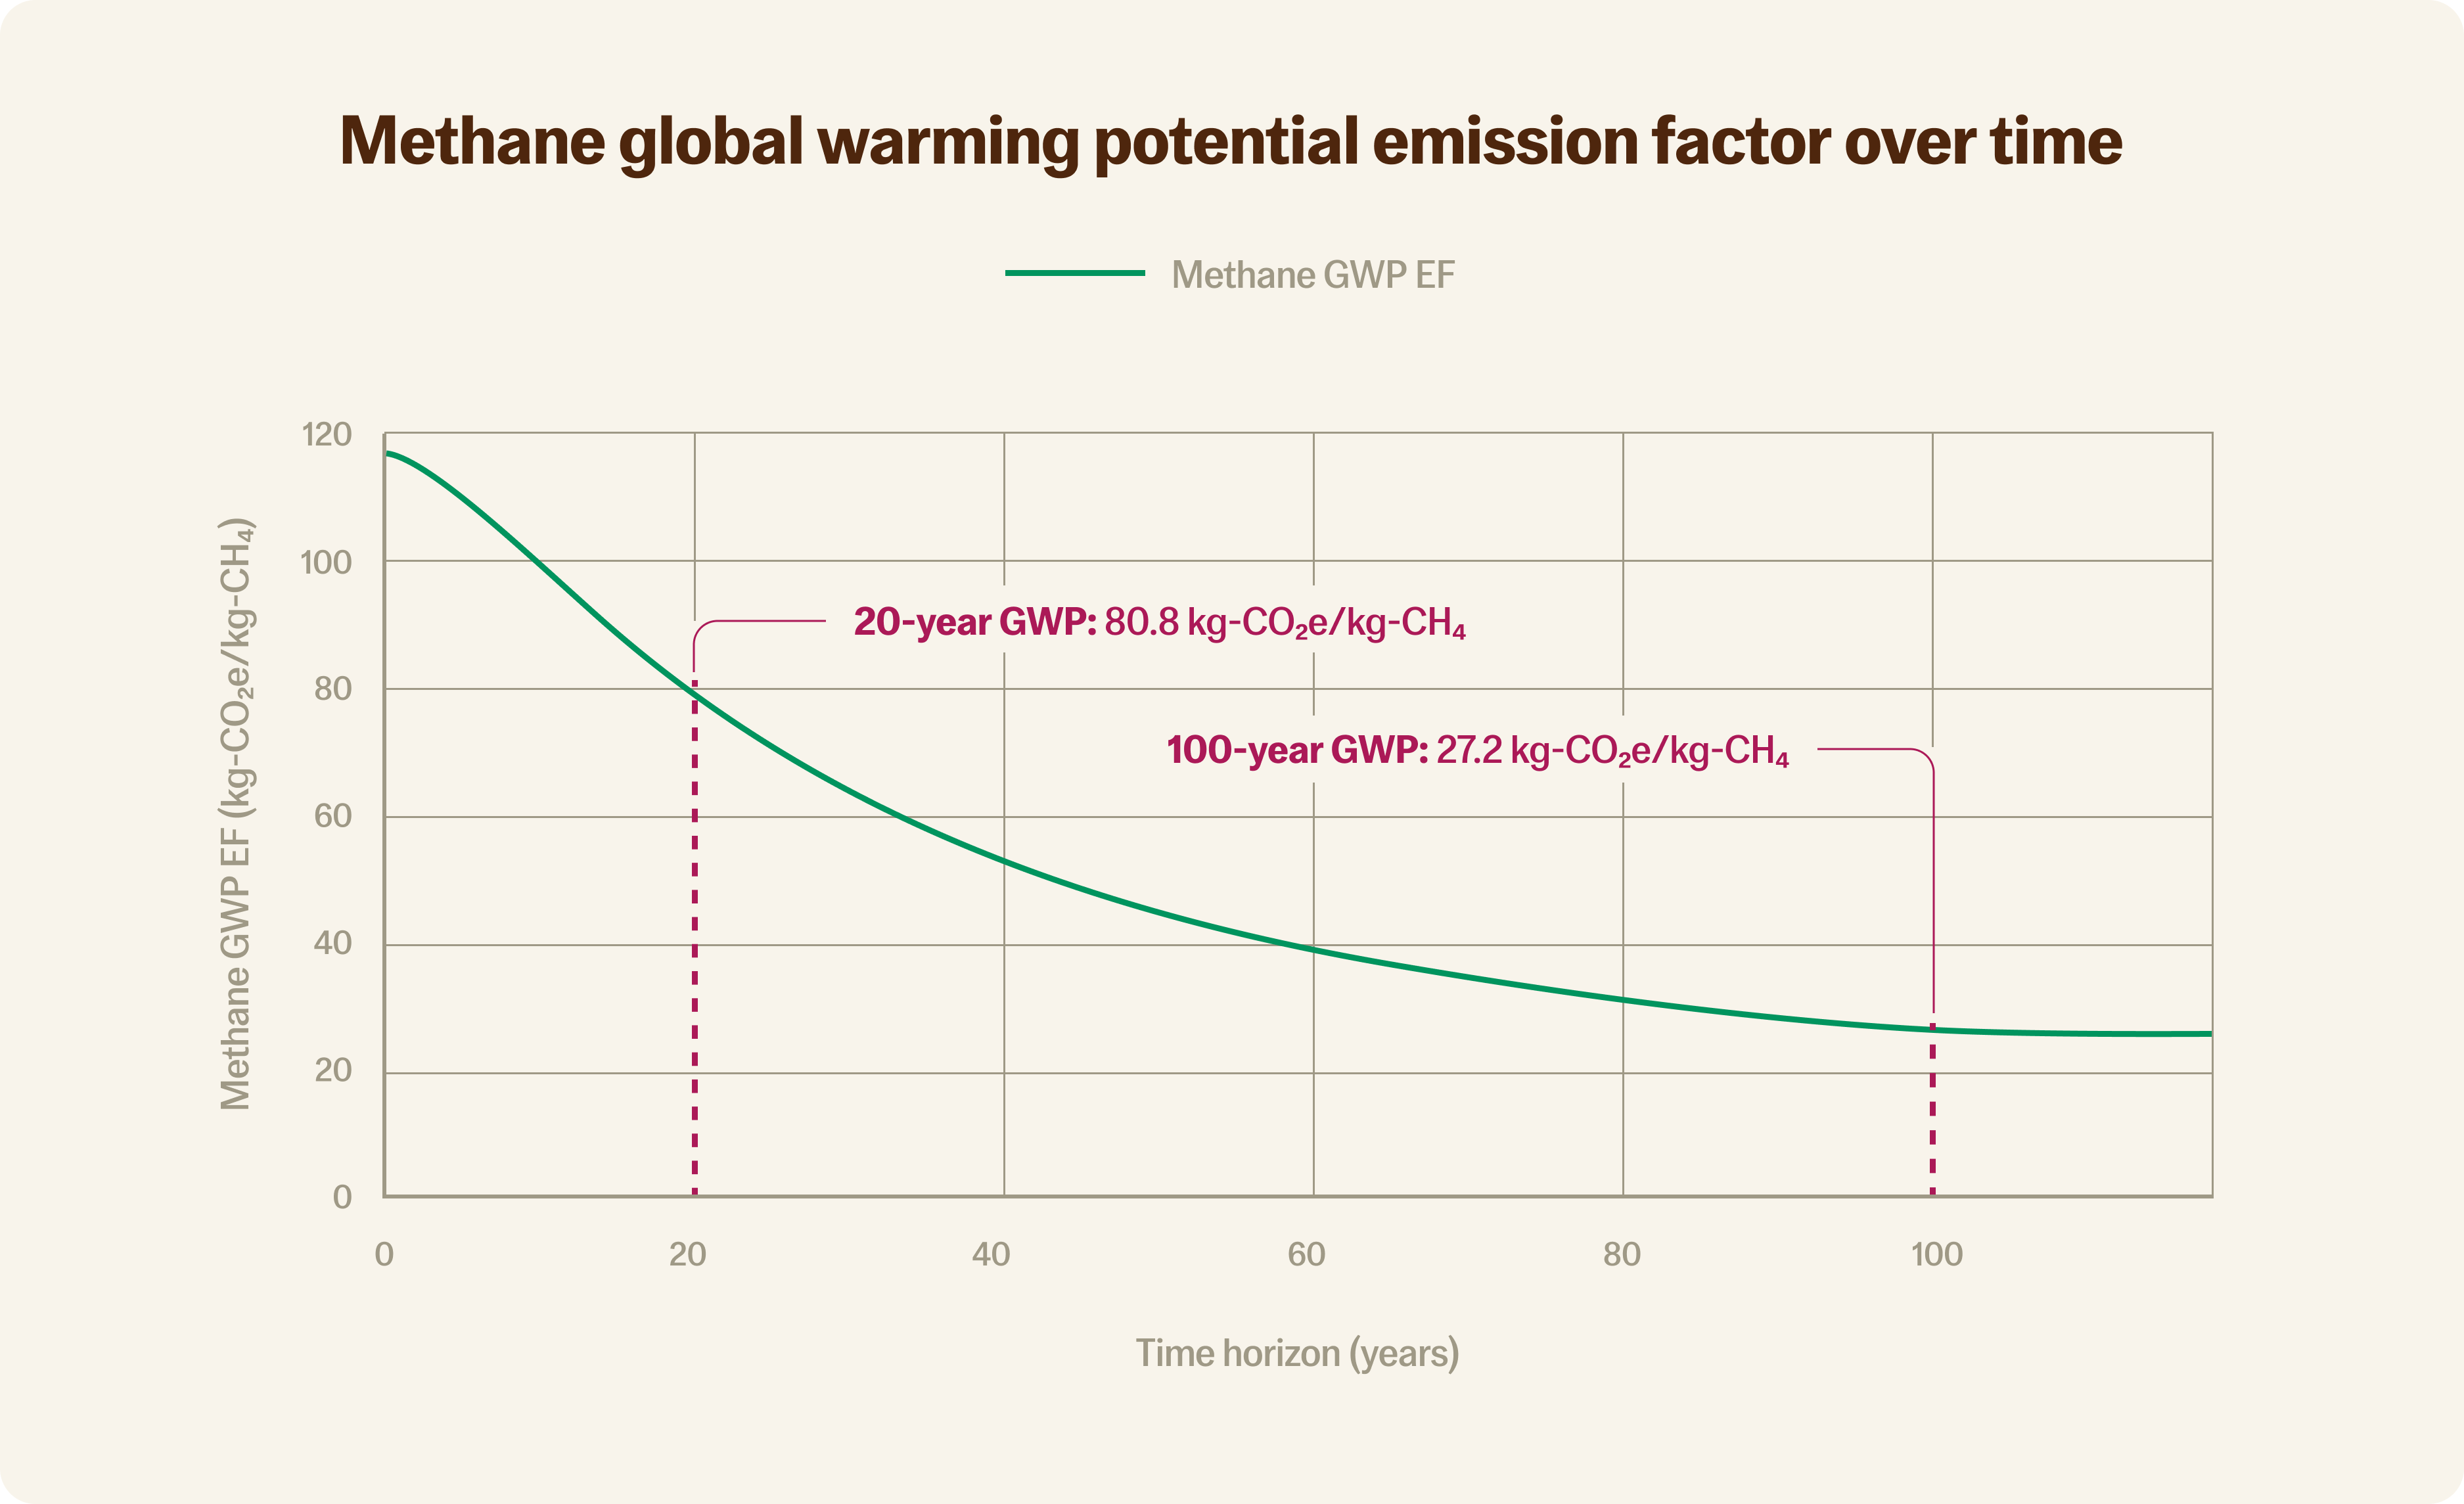
7
20-year (biogenic) methane global warming emission factor (GWP20)
80.8
8
100-year (biogenic) methane global warming emission factor (GWP100)
27.2
9
Counterfactual fate of kitchen scraps: %-landfilled
80%
10
Counterfactual fate of kitchen scraps: %-composted
20%
There are no rows in this table
1
Parameter
Value (constant across all scenarios)
2
Kitchen scraps generation rate (lbs-wet scraps/household/day)
1.326
There are no rows in this table
References
Want to print your doc?
This is not the way.
This is not the way.

Try clicking the ⋯ next to your doc name or using a keyboard shortcut (
CtrlP
) instead.