Skip to content
Share
Explore
Horizontal Pod AutoScaling for Browserless
 HPA Infrastructure
HPA Infrastructure
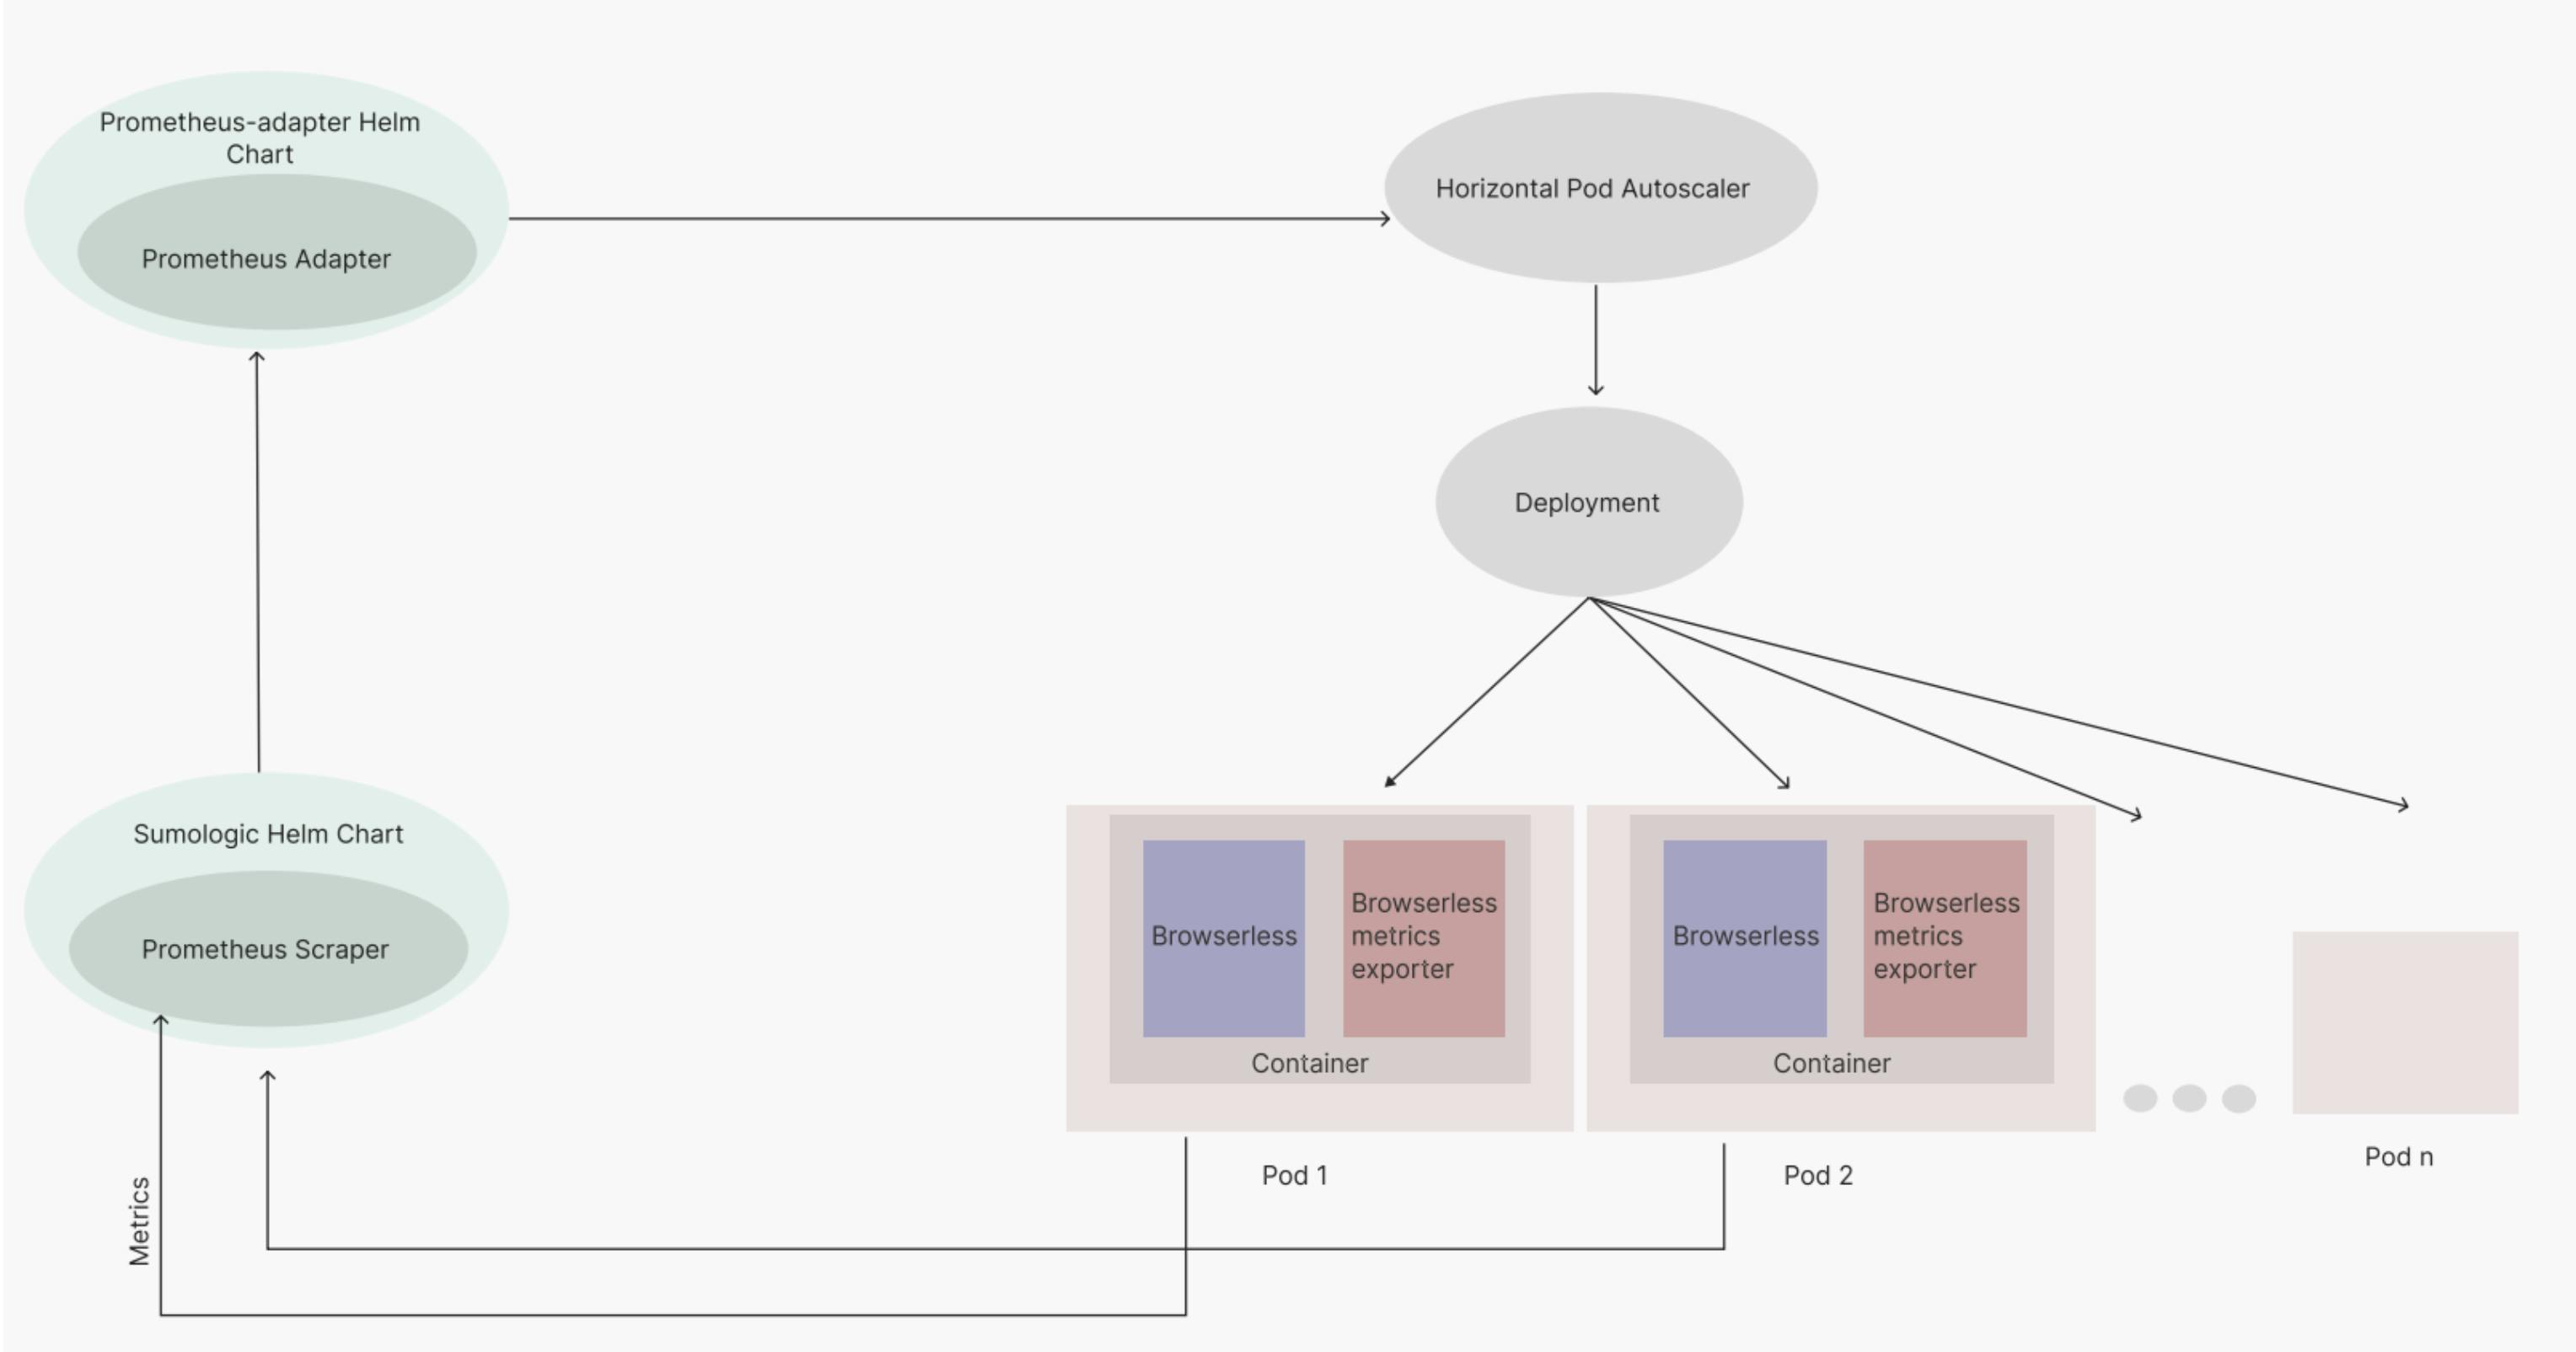
Infrastructure change
Scaling Policies
Want to print your doc?
This is not the way.
This is not the way.

Try clicking the ⋯ next to your doc name or using a keyboard shortcut (
CtrlP
) instead.