Skip to content


Bullet chart
KPIs
Indicators

OHLC chart
Stockmarket
Time series

Candlestick chart
Time series
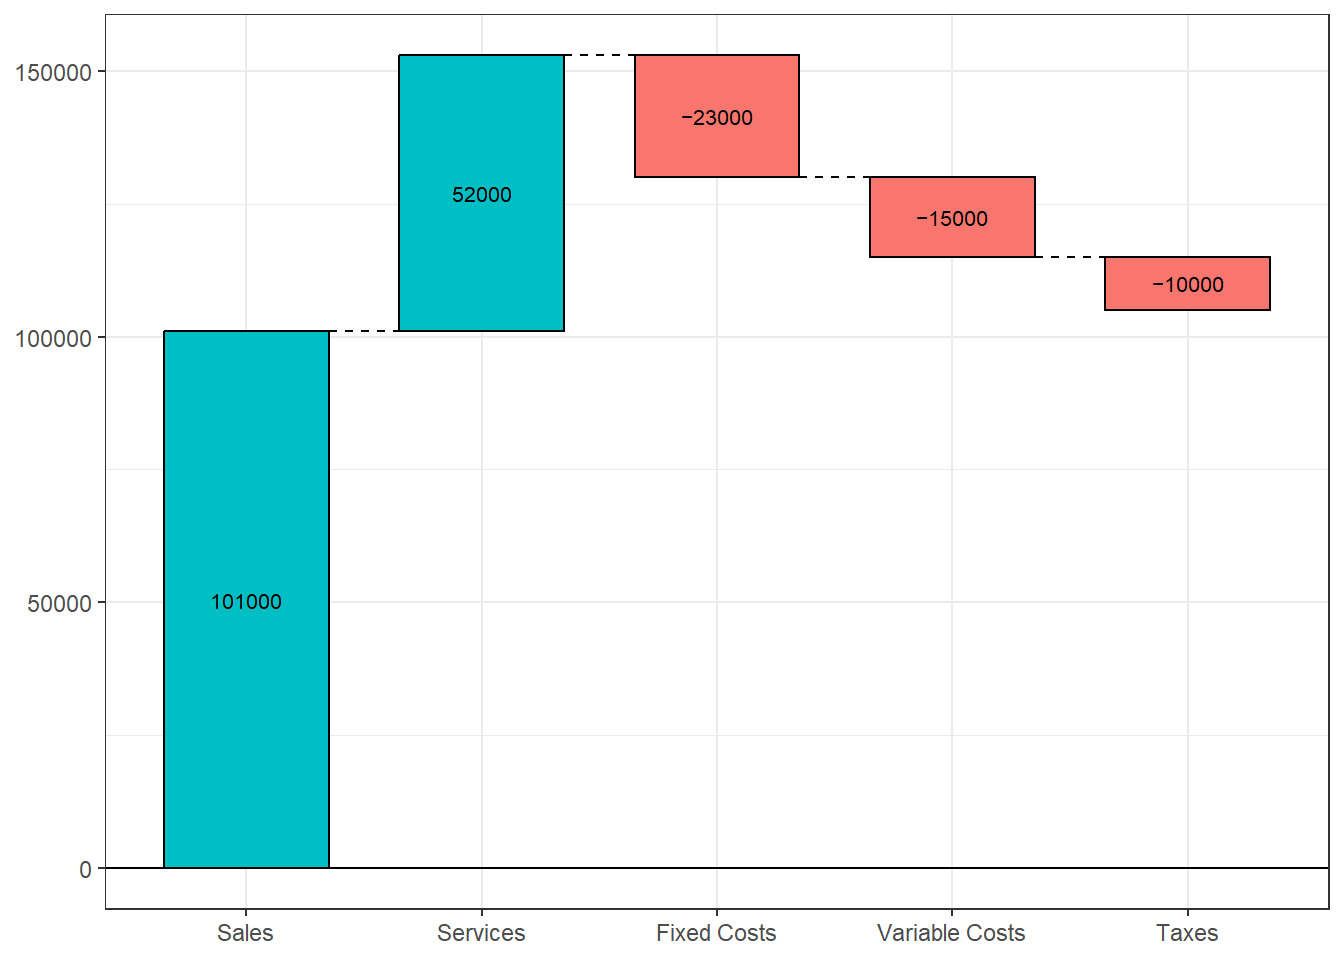
Waterfall chart
Cumulation

Funnel chart
Subset
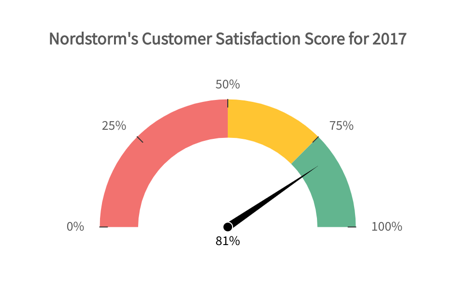
Gauge/indicator chart
Indicators
KPIs
Sankey/Alluvial diagram

Parallel coordinate diagram
Want to print your doc?
This is not the way.
This is not the way.

Try clicking the ⋯ next to your doc name or using a keyboard shortcut (
CtrlP
) instead.