Skip to content
Superpeer Dashboard Feature
Share
Explore

🤙 PRD: Superpeer Dashboard Feature

Project:
Private embeds
EDIT INFO
Team:
@Collaboration
Contributors:
Giray BATITÜRK
Giray BATITÜRK
TL;DR:
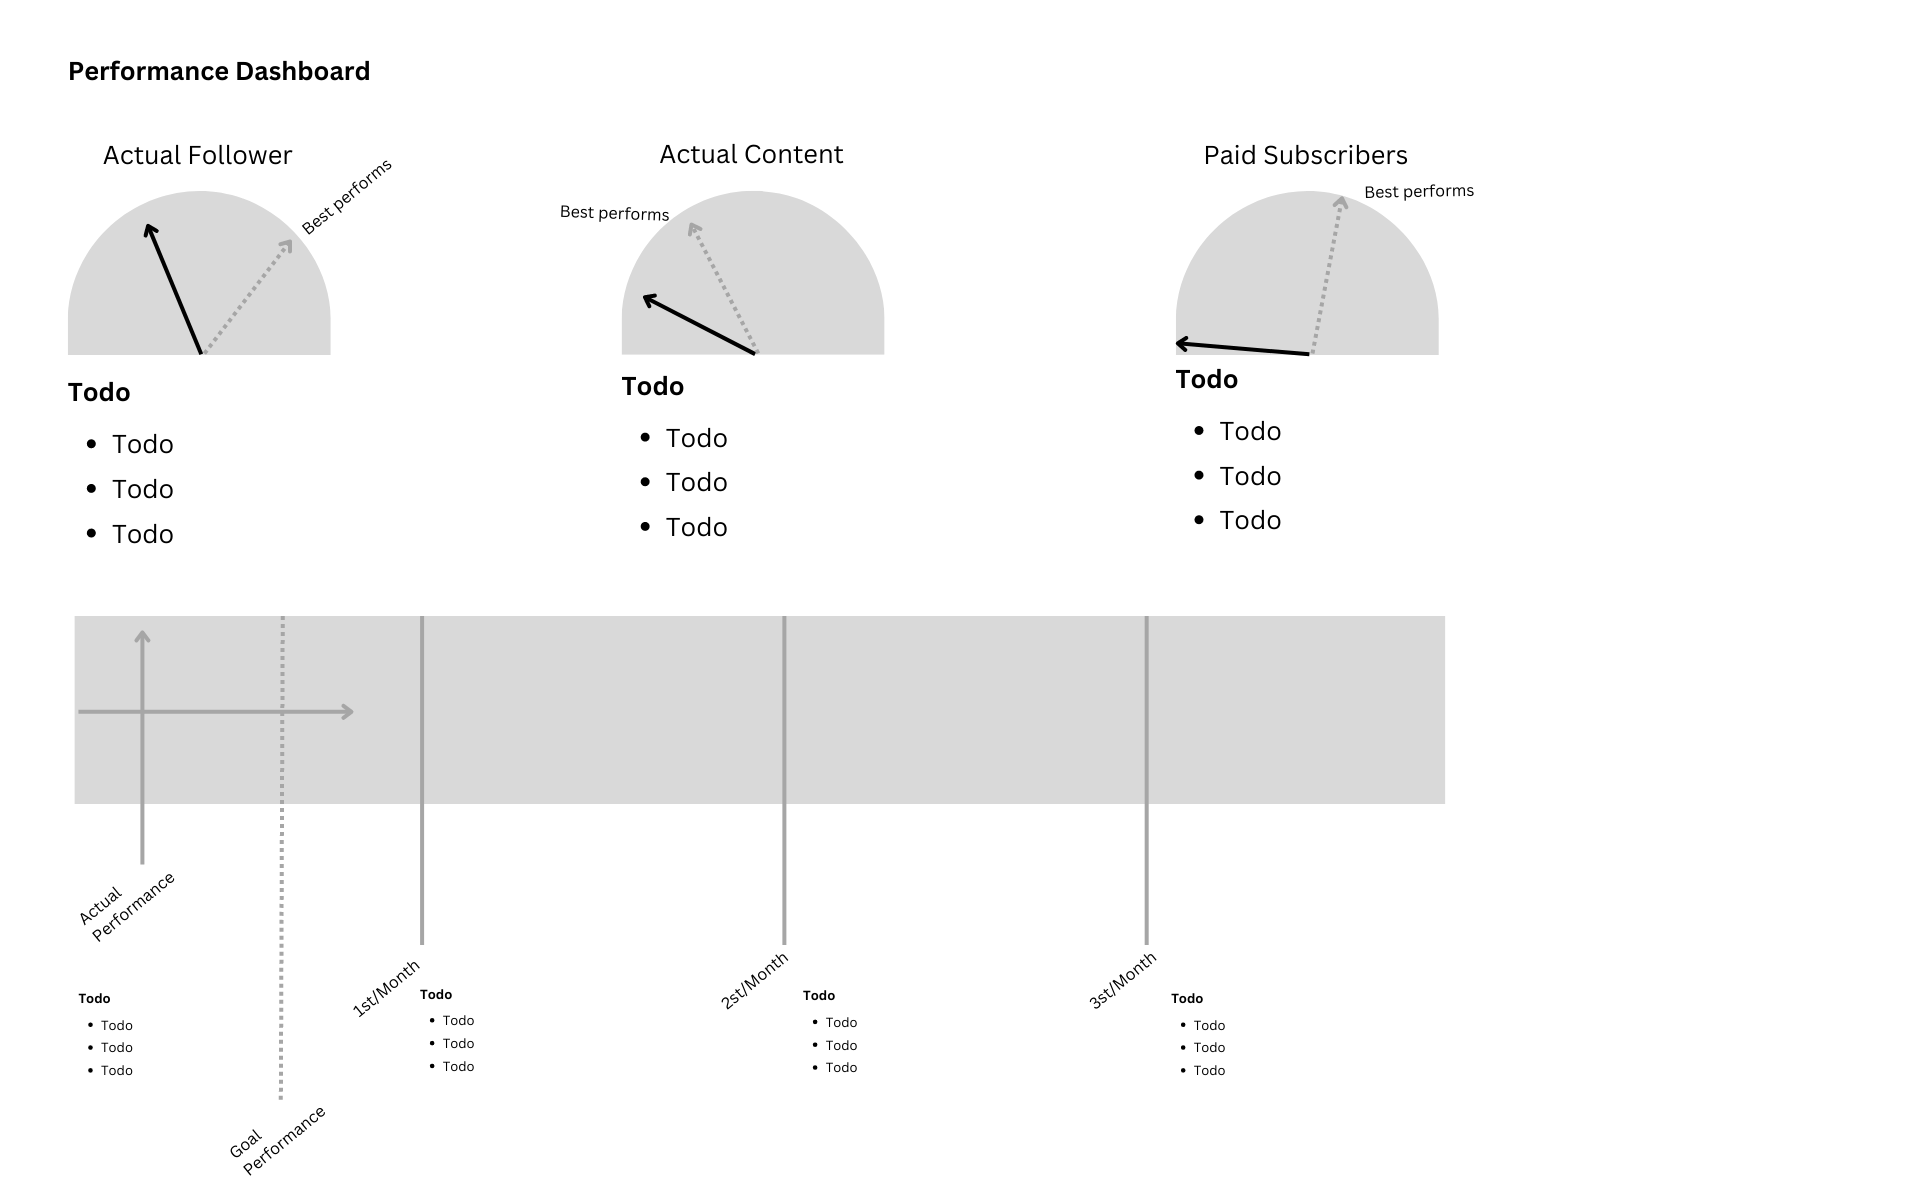
Provide Users with a Dashboard for Benchmarking as well as their Performance Mapping.
Status:
@Early Thinking
Shipping:
Oct 27, 2022

Problem Alignment

The Challange

The challenge of the business is to improve the user base as well as increase paid subscribers by 5x over a period of 12 months.

The Problem

The major problem regarding the business need is the existing business structure, the existing structure does not support a professional guidance to users and new users. They have to find and develop their own way of doing and running their business over the platform. This is a roadblock for existing and potential users to develop and distribute their value over the platform. Most of the users try to benefit from limited features however platforms promise and expectation of the users at some point clash.
In our business model, we expect the user to develop their community however creating awareness around features that can maximize users’ effectiveness and utilization is a gap in the functioning of the model that does limit fast startup.

The Opportunity

A paradigm shifts in creating a level of competition among users, effort vs income would internally trigger the required self-motivation to achieve more. Therefore, a functioning dashboard to make user efforts visible would be the initial trigger to accelerate desired time investment as well as high quality content.

High-level Approach

Describe briefly the approach you’re taking to solve this problem. From a strategic standpoint, dashboard with key measures can provide required awareness around Income Potential. The key metrics will be defined under the Solution Alignment. The critical part is to provide a progress rating based on income and time spent through active comparison with the engaged users and best performers.

Goals & Success

Progress based indicators and comparison-based indicators and their graphical presentation by placing UX in the development process will for sure present meaningful data for awareness. The awareness around Investment vs Potential Income opportunity will be visible. Therefore, a screen customized for each user with key metrics performed, will guide the user to take necessary action and improve the attraction and engagement of new subscribers into the system which will be a relevant starting point.

Solution Alignment

Mockup


Actual Follower.png


Potential Impact

The potential Impact will be in three dimensions.
The initial impact is to improve the total amount spent by the users on the platform by uploading new content that will be worthy which will enrich the platform content wise. The principal idea is to measure the content development so Specific measures covering video viewers, average consultation, average live training attendance etc...
The second impact will be in the growth of total subscribers therefore a measure of average subscriber per user will be a relevant measure to watch ( the formula will be a critical success factor)
The third impact will be in the growth of paid subscribers. After the baselining process, daily paid subscriber measure compared with the daily target will be essential tools for Superpeer to watch its business growing.

Potential Risks

The initial risk for Superpeer is to adopt to the paradigm shift, which suggests a new model for the flow and control of the daily business.
The second risk is to manage the transition of users for a new operating culture to leverage their business.
The third risk is to comply with GDPR regulations
The fourth risk is to prepare a transition plan for the feature and a smooth engagement plan for the user to benefit
The fifth risk is to make sure similar and describes features like the Dashboard should work in parallel therefore resource planning for scarce resources and succession planning should be in place.

Key Milestones

Below is a descriptive approach of how a total of 5 features may be gathered as a project and potential stages of pre-project (planning, resource identification, work package) and progress mindset with a defined improvement process for the project execution to support the business-case.
Date
Milestone
Audience
Description
Column 5
1
Mon, Oct 3
Results of the Brain Storming & Idea Generation Workshop
Internal employees only
Idea Acceptance Meeting,Introduction to the new Paradigm
2
Wed, Oct 12
UX Research
Early research among 10 users and 100 customers
Critical User and Subscriber research
3
Thu, Oct 20
Initial Planning of the Project
Introduction of the resource planning for the features time lines and resources.
Project and Feature Planning Review Gann Chart presentation
4
Mon, Oct 31
Defining Risk & mitigation Plans for the Execution Phase
For Executive Managers
Risk Review Meeting and Overall Risk Presentation
5
Wed, Nov 16
Budget and Cost planning for the project
For Executive Managers and Related Operational Managers
Budget Presentation & Acceptance Meeting
6
Fri, Nov 25
Kickoff Acceptance.
For every member of the project and Executive Management participation is essential.
Kickoff & Initial Introduction to Project Followup Meeting /Progress Reporting/ Issues Review
7
Thu, Dec 8
Key milestone review
For every member of the project and Executive Management participation is essential.
Key Mile Stone & Qgate Acceptance Meeting
There are no rows in this table
Want to print your doc?
This is not the way.
Try clicking the ⋯ next to your doc name or using a keyboard shortcut (
CtrlP
) instead.