The Ultimate Coda Handbook for Planning & OKRs
Share
Explore

icon picker
Define the planning output

How planning dimensions and output are the bedrock of effective and efficient planning.
To begin, we will look closely at the structure of planning and the final output of your planning process. There are countless choices you can make at this step, each reflecting a different set of priorities. To name a few, you can:
Restrict focus to a set of top priorities and construct the planning and communication process entirely around them.
Place heavy emphasis on metrics, ensuring each goal has a defined metric and associated dashboard.
Encourage your teams to focus on quality over quantity, outputting a limited number of goals.
Encourage bottoms-up innovation, providing wide latitude for team members to champion proposed goals.
In many cases, there are no simple answers to which of these choices you should prioritize. You should decide what is right for you based on the size and priorities of your organization and the strengths and weaknesses of your team.
You will need to revisit the structure and output of your planning regularly, as your needs will change over time. I typically recommend that teams revisit this at least annually. And of course, it’s crucial that your tooling provides flexibility for you to customize and scale your processes for years to come. I’ll discuss this more in

Planning dimensions and outputs.

Though defining the dimensions and outputs of your planning is a broad and complex set of challenges, I’ve found that the most important choices can be broken into the following categories:
Altitude: At which altitude do you plan?
Properties: What are the key attributes of your plan (success metrics, owners, etc.)?
Hierarchy: How do your plans roll-up across the different layers of your team’s hierarchy?
Connections: How do you manage goals shared across teams and dependencies?
Writeups: How do you create and manage the unstructured information associated with your plan?
Views: How do you create the right views of the plan for each team and each situation?
In the following sections, I will walk through the potential solutions space, with concrete examples inline, and provide my recommendation based on my experience running dozens of teams and talking to hundreds of our customers.

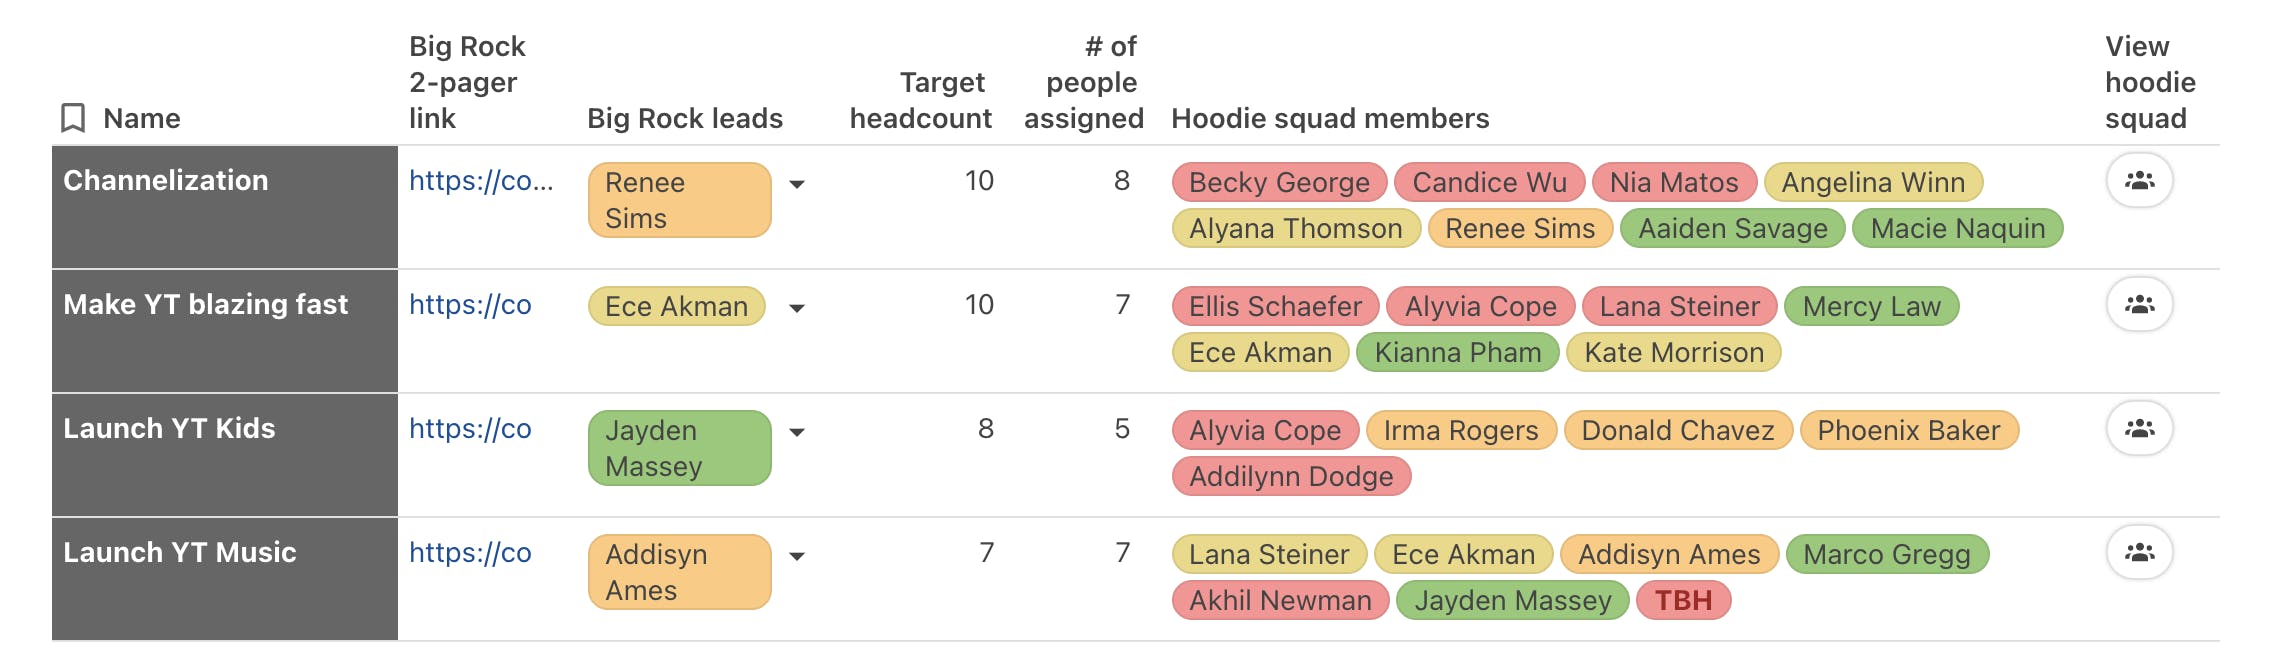
1. Altitude: Big rocks, objectives and key results (OKRs), and resource mapping.

The first and most fundamental dimension of planning is the altitude at which you plan. I’ve seen teams take widely different approaches: some setting very high level goals, others defining a range of broad and specific priorities, and some building granular resource maps connecting goals to budgets. That being said, I think the option space can be reduced to three potential altitudes.
Let’s look at each of these potential altitudes in more detail. But before we dig in, I’ll cut to the chase and say that for most teams, I think OKRs provide a strong compromise and are the best place to start.

Big Rocks

By starting with the largest and most important bets, it gives your team the ability to examine how their individual work ladders up to the shared goals.
Every company needs a process to determine their Big Rocks and to communicate them to their teams. I will outline some useful techniques for constructing Big Rocks in the second chapter of this handbook. Once finalized, Big Rocks are generally presented with a slide deck along with a mechanism for questions and sentiment to facilitate better discussion. At Coda, we use a ritual called . Here’s what the combination might look like in Coda:
Pulse: How are you feeling about these Big Rocks?
Author
Sentiment
Reflection
1
Polly Rose
Love this! Such a clear way of thinking about the business. Thank you for putting this together!
2
James Booth
Curious –– how will we deprecate last year’s bets?
3
Joel Davis
There’s all sorts of awesome in this! Still need to figure out the details, but I’m excited!
There are no rows in this table

Objectives and key results (OKRs)
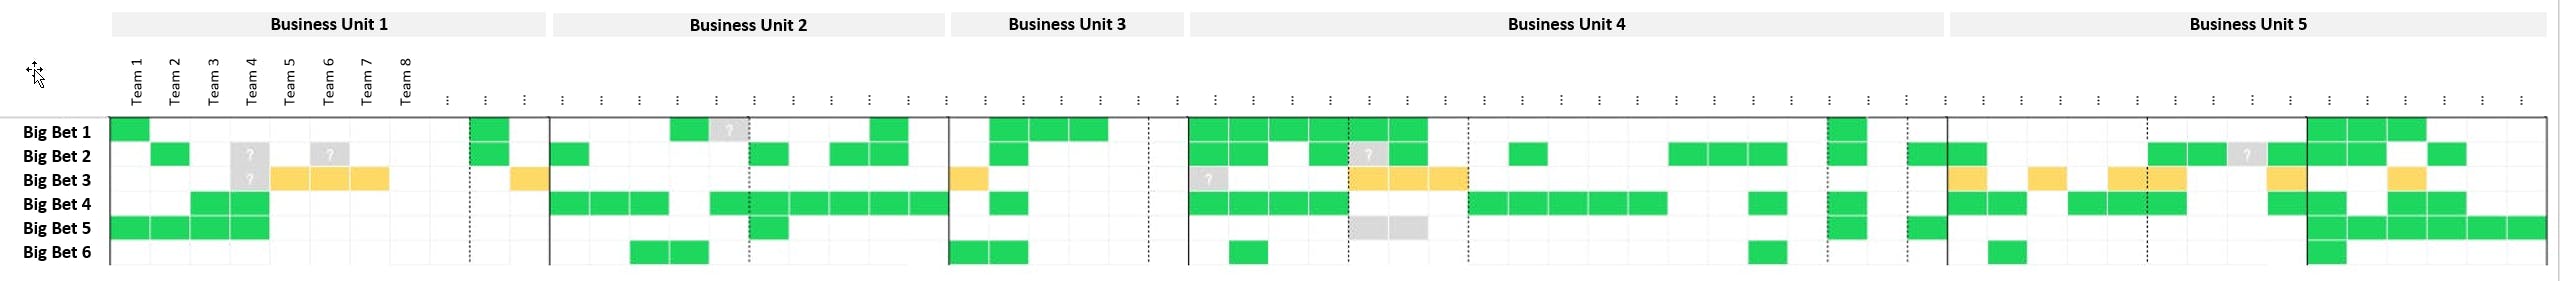
For a small, fast moving company, the simple list of top bets, Big Rocks, can be enough to keep the team aligned. As teams grow, planning becomes more spread out, more complex, and more detailed. Lists of projects expand, spreadsheets of tasks proliferate, and writeups on upcoming plans balloon. By far the most common framework to handle a large, scalable planning process is Objectives and Key Results (OKRs).
OKRs originated from Andy Grove and his process for tracking goals at Intel. John Doerr, a then-salesmen at Intel, carried the to his new job at venture capital firm Kleiner Perkins. He introduced OKRs to Google—one of Kleiner Perkin’s investments—who, according to Google co-founder Larry Page, used them to propel 10x growth on multiple occasions. If you want to learn more about how Google uses OKRs, I recommended watching this and reading John Doerr’s book, Measure What Matters.
In brief, OKRs aim to align individual, team, and organizational goals to measurable outcomes. An objective is a qualitative goal that is meant to be ambitious and inspiring, very similar in intent to the Big Rocks discussed previously. Key results, on the other hand, are the quantifiable steps that indicate progress toward achieving the broader objective. These two concepts work together to maintain high level guidance while providing metrics driven, actionable tasks.
Given the above, it will be no surprise that we use OKRs at Coda (with some tweaks as outlined by our Head of Product, Lane Shackleton, in his fantastic doc). Here’s what a simple example of structured OKRs might look like:

Resource mapping

Without fail, at every company where I have lead or observed planning processes, a proposal to incorporate budget requests into the planning process has emerged. This idea seems quite reasonable on the surface—why not prioritize and decide on budget alongside your prioritization and decision making for projects, given those projects will be impacted by the budget? Unfortunately, incorporating budget decisions during planning changed the incentives for organizational leaders. I’ve seen this combination lead to an increase in defensiveness and competitive behavior that can be detrimental to the quality and speed of the regular planning process.
Stepping back, large budgeting decisions are often annual, while planning tends to be more frequent (often quarterly). In practice, you will end up with a single planning cycle with big budgeting decisions followed by three planning cycles with minimal or no changes to budget. As an engineering leader, I prefer to separate headcount budgeting from quarterly planning. Any newly allocated headcount budget will take weeks to hire, weeks to onboard, and weeks to ramp up on team knowledge. In reality, very little work will be completed in the first planning cycle by a new hire allocated in the previous planning cycle. This reasoning may be less valid for other job functions or for moving employees across teams or projects.
This being said, if your headcount and other budget adjustments are an important aspect of planning, resource mapping is a fantastic tool. Lifting an example from our CEO Shishir Mehrotra, YouTube used a matrix to do this alignment which they called hoodie squads. The squads were defined as the set of people across multiple teams working on a specific Big Rock. It was named because of the litmus test “if you were to wear a hoodie with the name of the team you were on, which hoodie would you wear?”. To read more about this, here.
Screen Shot 2021-09-13 at 8.08.34 PM.png
Borrowing another example, the team at Spotify used a similar matrix, visualized in an interesting way like this redacted version.
image.png

If you want to include resource mapping as part of your planning, I also want to point you to my . It helps manage your headcount budget as well as ties it to your current staffing, potential staffing changes, and tracks open roles for recruiting. I call this approach the Staffing OS, which you can read more about in the .

2. Properties: Attributes assigned to each objective and key result.

Common examples of key result properties include:
Description or Writeup
Assigned Team(s)
Owner or DRI (directly responsible individual), Sponsor (also see )
Success metric, and link to metric dashboard
Progress score, status (also see )
Here’s what putting some of these together might look like in Coda:
Team(s)
Objective
Key Result
Driver
Status
Progress
Writeup
Product
Redesign user interface
Test the redesigned user interface
Lola Tseudonym
Green
000
10
Engineering
Integrate AI into core algorithm
Analyze and evaluate current AI algorithms
Joel Davis
Green
000
75
Complete testing and validation for launch
Lawrence Fitzgerald
Yellow
000
30
Build dashboards to analyze ongoing performance
Joel Davis
Red
000
40

3. Hierarchy: Nested levels of objectives and key results.

As organizations grow, so does the number of key results they work towards. There are different approaches on how to manage a growing number of objectives and key results.
For a practical example of how these elements can come together, I’d recommend you take a look at , a fantastic example of a strongly modeled hierarchy. In Pinterest’s system, team KRs ladder up to “Pillar” key results. These pillars are very similar to the initiatives described above.

4. Connections: Shared and dependent key results.

Shared key results

Often, key results are not worked on by a single team, but rather shared across multiple teams. These cross-team KRs are among the most critical KRs in the company.
Shared KRs can lead to tooling issues. Companies that use spreadsheets for their planning have a section of the spreadsheet for each team. They share KRs by duplicating the key result and noting that it is mirrored for some other team. This works for very trivial cases, but it is quite a brittle system that goes out of date if you forget to update duplicated rows anytime you make a change. Worse still, you need to update multiple copies of the same KRs throughout the quarter.
In Coda, you can simply make the team assignment a multi-select, allowing multiple teams to be assigned to the same key result. This means that you have a single source of truth, and no chance of your data going stale.

Dependencies

In practice, most teams depend on at least one other team to complete their key results. But these dependencies are not the same as a fully shared key result among equal partners. Rather, some support is needed to unblock a critical aspect of the task. For example, the product team might have a dependency on the data team to expose a specific metric from the data warehouse to make an informed decision. Teams that other teams have many dependencies on are teams like data, marketing, or infrastructure teams.
In most companies, dependencies are not explicitly tracked during planning, instead relying on team leads communicating them without support from the planning tool. In my opinion, that is error prone and inefficient. It can be easily improved with tooling support by adding a property (a column in Coda) that notes which teams are depended upon to complete each key result. For a more advanced solution, you can build a separate schema to track dependencies with prioritizations and a way for the partnering team to acknowledge or reject their support:
KR
Driving Team
Partnering Team
Notes
Priority
Acknowledge
Reject
1
Create wireframes and prototypes
Design
Engineering
The Design team reached out to the Engineering team, requesting support in creating wireframes and prototypes for their latest project, as they require their expertise in developing functional and user-friendly designs.
2
Analyze and evaluate current AI algorithms
Engineering
Product
Engineering is asking Product for support on analyzing and evaluating current AI algorithms, as they are in need of their expertise and input to ensure the project's success.
There are no rows in this table
Then, in your key results table, you can have an easy mechanism to see and edit associated dependencies (try clicking the button!)
I’ll walk through how to set up dependencies and more in .

5. Writeups: Strategy memos, objective descriptions, goals, and more.

Inevitably, the structured data in a key results table is not sufficient to capture the full intents, goals, and plans your team develops. When this happens, the result is some form of unstructured writeup like a memo or description. Recently, I heard a quote from one of our customers about their planning process:
“We have over 200 docs for our annual planning process... It’s impossible to keep track.”

Three common examples of the types of writeups we see teams use when planning in Coda include:
In each of the above three examples, the unstructured data of the writeup is blended into structured data from the planning doc. In the top down guidance, there is a discussion topics table that can be referenced later in objectives or key results. In the key result description, there are properties about the associated objective, owner, and team. And in the team final presentation, there is a summary of all of the team’s key results.

6. Views: Dashboards, timelines, and presentations—different ways to view your OKRs.

So far, we have discussed how to capture all structured and unstructured planning information for planning. That is, however, only half of the story. The other half is presenting the right information in the right way at the right moment. A few examples include:
Creating a personalized detailed view of the specific (few) OKRs that a person is responsible for driving.
Creating a summary view for all the OKRs that a team or a department is driving.
Creating a quick visual dashboard for the CEO to judge the overall health and progress of OKRs for all top objectives.
A presentation view with detailed background information about the objectives and specific key results for new employees to learn and understand (plus everyone who wants to refresh their understanding of the company’s plan)
There is no one size fits all or one view fits all, making it important to be able to create multiple views of the same data. That means your tool needs to behave more like a database than a spreadsheet. And it needs to be able to render OKRs as tables, cards, timelines, pie charts, and other visualizations, optimized for the specific purpose.

Personalized views

Here’s how a personalized views of OKRs might look for two different people looking at the same table in Coda:

Card view

Our team meetings often start with a quick look at current OKR scores, leveraging a card view in Coda and sorting by score:
Making our CEO laugh so hard he snorts coffee out of his nose during our monthly review meeting.
Amy Shaw
000
100
Achieved 100% employee satisfaction by providing unlimited free coffee and donuts in the office.
Rocky Moon
000
69
Successfully convince the CEO to let us have a company-wide puppy day as a team-building activity.
Rachel Ding
000
59
We increased employee productivity by 500% by replacing all chairs with unicycles.
Noah Silverstein
000
54
Our key result will be so hilarious that even the most serious of coworkers will crack a smile.
Jordan Milner
000
32
Achieve world domination by teaching cats to operate can openers with their paws.
Joe Bauer
000
31
We increased productivity by 200% by implementing a daily “dance break” in the office.
Oliver Heckmann
000
12
Congrats on the progress, Amy! But Oliver, time to step it up...

Chart view

Soon, I’ll be releasing the which will give you step-by-step instructions on how to set up your OKR doc in Coda, including building various views and dashboards. If you’re interested in getting a sneak peek, and I’ll notify you when I release it.


Share
 
Want to print your doc?
This is not the way.
Try clicking the ⋯ next to your doc name or using a keyboard shortcut (
CtrlP
) instead.