Share
Explore

icon picker
How to export and analyze Jira issues in Google Sheets vs. Coda

Tutorial on exporting your Jira issues into Google Sheets and Coda, and comparing the two different platforms for analyzing and syncing Jira issues.
Once your Jira backlog of issues grows to a certain point, you may want to view all your issues in another format like a spreadsheet to figure out what your team should focus on. In a spreadsheet, you can quickly filter, sort, and organize issues by multiple dimensions like priority, due date, and status. The issue is that the spreadsheet is only a snapshot of your Jira issues. As your team makes updates in Jira, those updates to sync to your spreadsheet unless you use an add-on like . An alternative is to use a in Coda to sync your data from Jira in a table format.
In this tutorial, I’m going to show you how you can do a regular export of Jira issues into Google Sheets and how to analyze issues once they’ve been exported. I’ll also show how you can do a similar type of export in Coda except the issues in Coda will stay synced with your Jira project.
Skip straight to the video tutorial below and check out this template for the part of the tutorial focused on syncing Jira issues into Coda:
Loading…

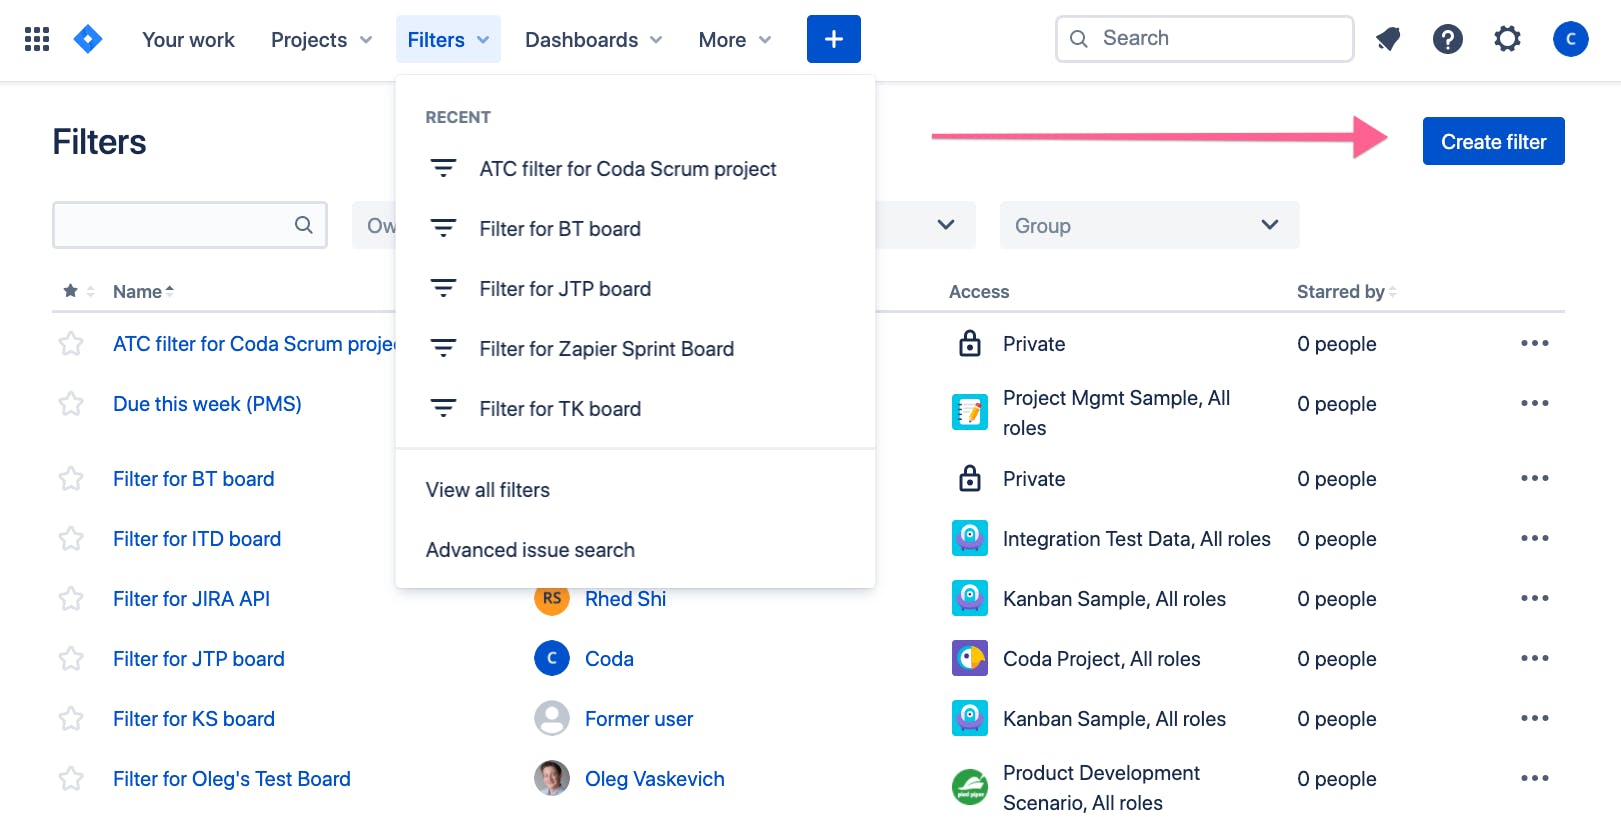
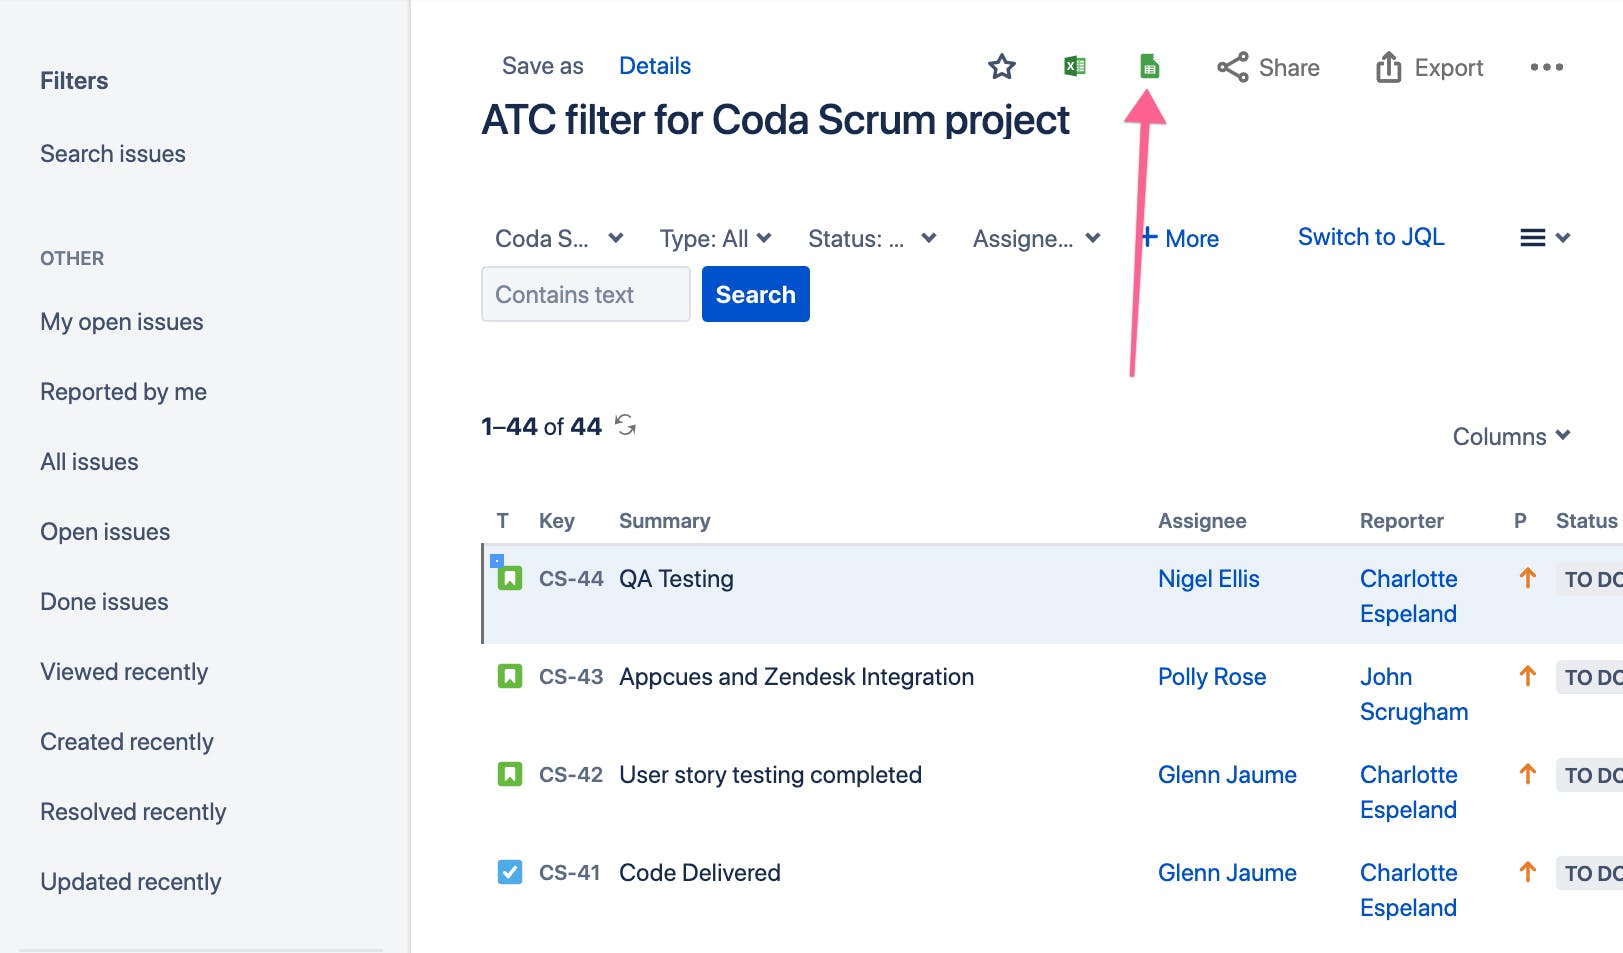
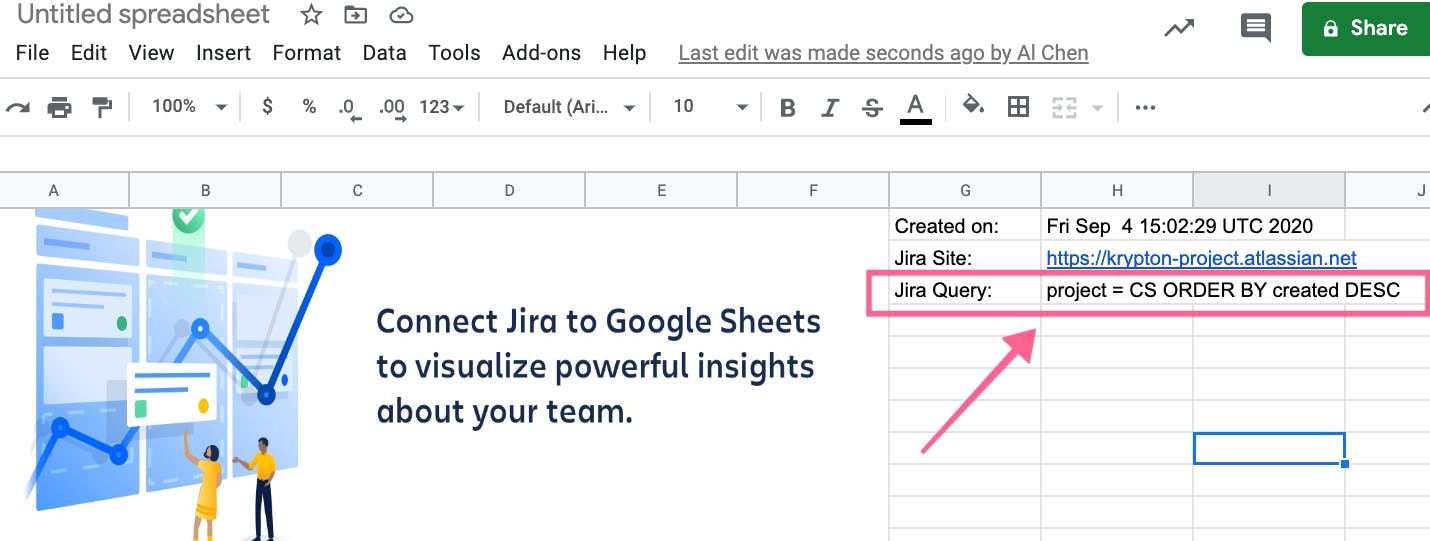
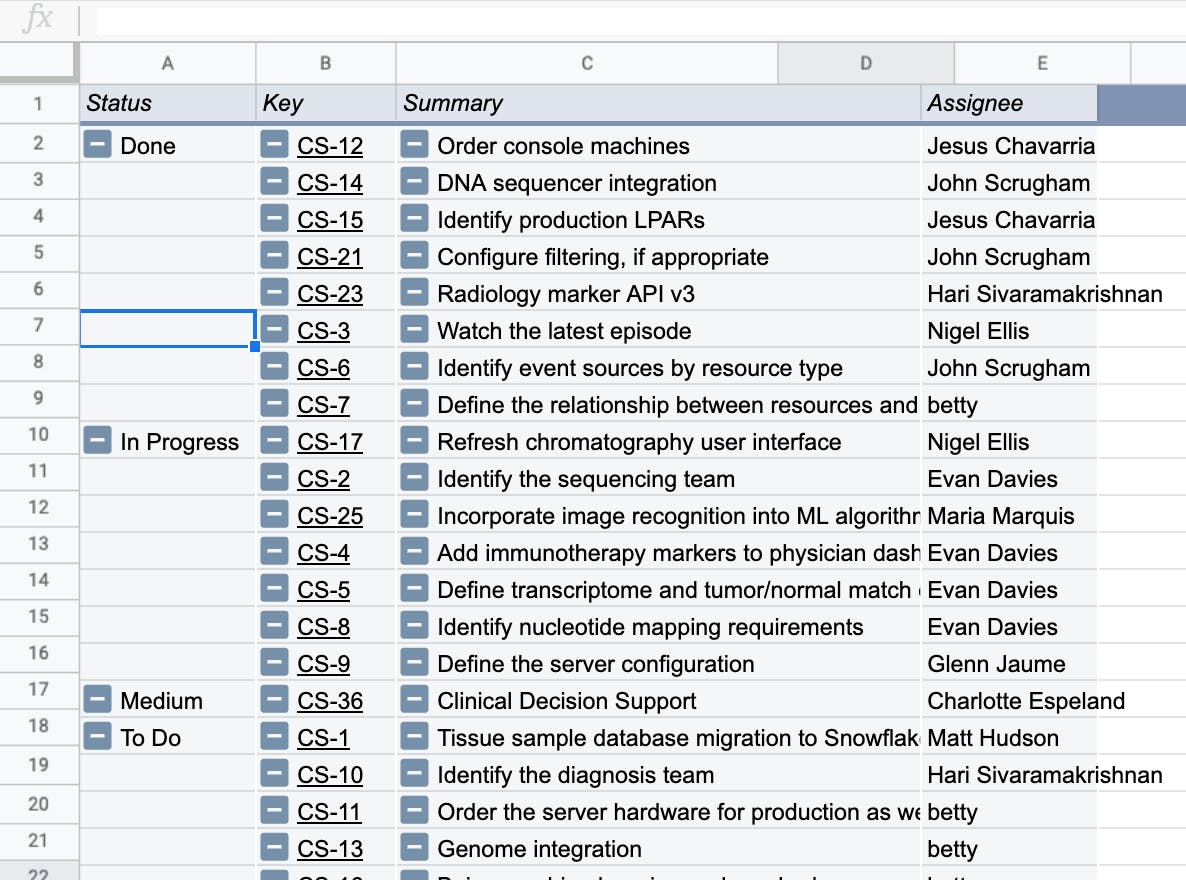
Exporting Jira issues to Google Sheets

This is assuming you are using the hosted version of Jira. Before you can export, you need to of your issues for your project. Under the Filters menu, click on View all filters and you’ll see a Create filter button to the right:
1jira.png
After you’ve created the filter for your project, you’ll see an Excel and Google Sheets icon near the top of the screen:
2jira.png
This will give you a clean export of your Jira issues. An important note:
This export only gives you a snapshot of your Jira issues. Any updates you make in Jira will not get reflected in Google Sheets and vice versa.
Your new Google Sheet will contain two worksheets: About and Your Jira Issues. The About page just contains some images about using (useful if you want to keep data in-sync from Jira to Google Sheets). The Jira Query shows up on this worksheet which is useful if you are using (JQL) to query your Jira project and/or using the Jira Cloud for Google Sheets add-on.
3jira.png

Playing with your Jira issues in Google Sheets

Getting a tabular view of your Jira issues is really useful since you can see all the fields for an issue organized along the top of the spreadsheet. A logical next step here is to filter your list of issues by a field like Status. Here, I’m setting up a filter to see all issue that have a Status of “To Do.” You could of course apply multiple filters depending on what you want to see (all issues with a Status of “To Do” and Created on 8”/16/20”).
4jira.gif

Dealing with teammates who want to filter Jira issues

The issue with doing a basic filter like this is that your teammate may want to see the issues assigned to him or her and perhaps color those rows a certain way. Every time your teammate jumps into the Google Sheet and applies their own filters, this will “overwrite” your own filter that you applied.
This is where Filter Views in Google Sheets come into play. You can tell your teammates that once they have filtered the list of issues to their heart’s desire, have them create a Filter View by clicking the Data, Filter views, then Save as filter view. Below, I have filtered the list of issues to Status of “To Do” and the Assignee is “Polly Rose.” I then create a filter view called “Polly’s issues”:
5jira.gif
Now, if a teammate goes into the Google Sheet, they can click on Data, Filter Views, and see a list of filtered views created. They can then pick the filtered view they have created without messing up anyone else’s filters. When you close out the filtered view, the list just goes back to the full list of unfiltered Jira issues.
6jira.gif

Creating copies of your issue list into multiple worksheets and keeping data synced between worksheets

This list of filtered views could grow quite large, so another option is to create multiple copies of your list of issues and perhaps each worksheet is meant for a specific teammate, only contains issues of a certain Status, or some other field. It depends on the structure and needs of your team.
The big question is this: does the list of issues need to be synced across worksheets in your Google Sheet?
If the purpose of exporting your Jira issues to Google Sheets is to report and analyze issues, then this question is not important. My guess is most people are exporting into Google Sheets for this purpose, and doing the actual “work” of updating and logging issues in Jira directly. However, the power of the spreadsheet is that you can add columns and with custom formulas that calculate certain metrics off or your Jira issues.
You could create a formula to calculate the number of days between when the issue was reported and when the issue was last updated. Or a formula that groups issues into the Assignee’s team which means you have a table somewhere in your Google Sheet mapping team member to team (and you do a VLOOKUP to the team name).
With the above scenarios, you’ll have to find a way to keep your worksheets in sync with each other so that formulas get applied to all worksheets and not just one worksheet where you’ve written the formula. A common solution to this: use the QUERY in Google Sheets so that each copy of the main list of issues is not a direct copy, but rather a real-time query of the main list of issues.
7jira.gif
The syntax looks very similar to SQL, and in this case assume the “Your Jira Issues” worksheet is the main table of issues that won’t be changed. The columns A:L are simply the column in this worksheet that contain my data, but you may have to expand the column reference if you continually add more custom formulas to your main issue list.

Grouping your issues in a PivotTable

One final strategy for viewing and analyzing your Jira issues is by creating a PivotTable of your Jira issues. This strategy is similar to the QUERY function in that the PivotTable will always pick up any new data that is added to the main list of issues. I don’t think this is a common scenario since this is just a snapshot of your Jira issues, but you may have a recurring task of exporting Jira issues into Google Sheets which leads to new issues getting added into Google Sheets.
This use case of PivotTables is non-traditional since I won’t be aggregating any dimension in the “Values” of the PivotTable. The PivotTable could be interesting if you want to see how Story Point Estimate, for instance, changes depending on how your pivot your data. All I’m doing below is pivoting by Status so I can see all my issues grouped by a certain status:
8jira.png
To get this view of my Jira issues, I’m only adding dimensions to the “Rows” in the PivotTable and unchecking the “Show totals” box so I can get a clean view of the issues.
9jira.gif

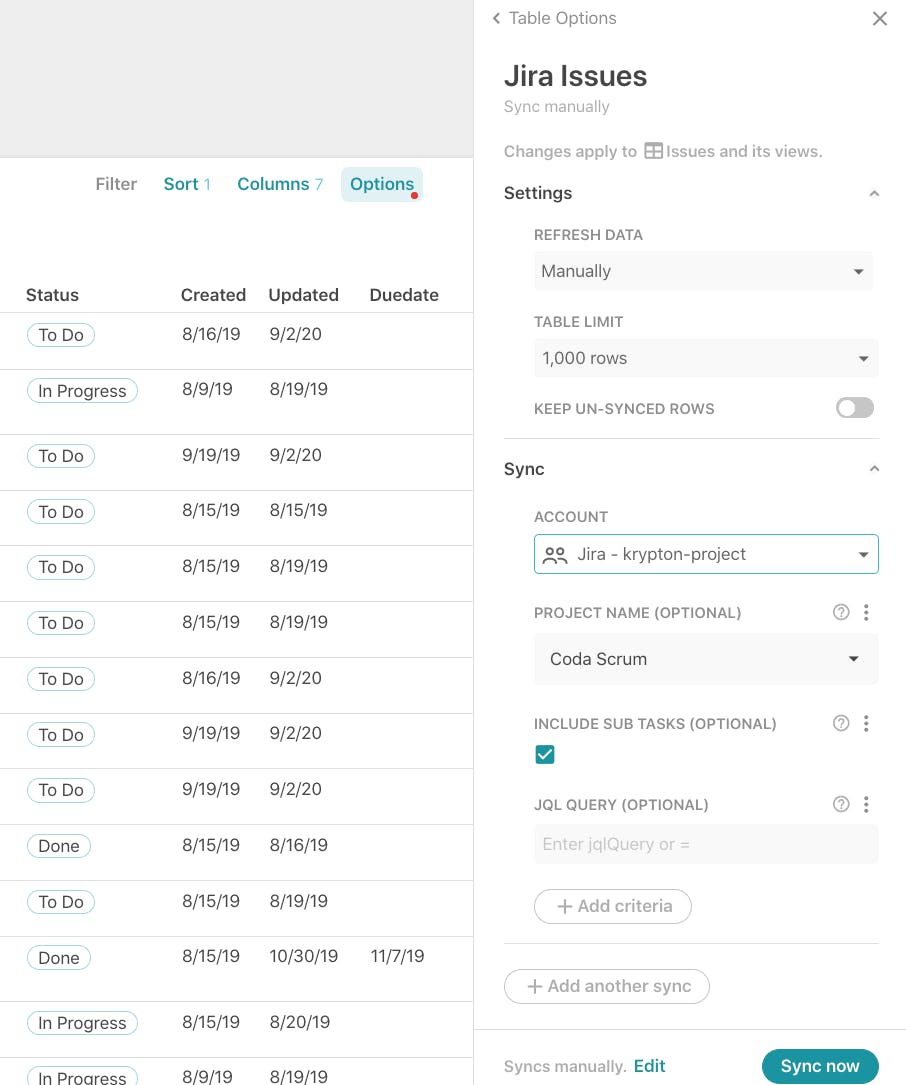
Exporting and syncing Jira issues into Coda

While I could do a simple copy and paste from the Google Sheet into a Coda table, the main benefit of Coda is this:
Updates in Jira will get synced into a table in Coda
As mentioned above, there is a special type of table called Packs tables, which are tables that allows you to visualize tabular data from popular tools like Jira, Gmail, and Google Calendar in real time. In this case, I’m creating a :
10jira.gif
When you click on the Options in the table, there are a variety of settings that let you control how often data is synced over from Jira and what data is actually synced over:
11jira.png
Some options to choose from:
Refresh rate: Manual or every day/hour
Table limit: How many rows to sync over (may want to limit if you have thousands of Jira issues)
Project name: Sync over issues only from a specific project
Include sub-tasks: Jira issues can be broken out into sub-issues, so know the parent or child of an issue may be important for your workflow
JQL Query: Further customize exactly what issues get synced over with JQL

Adding additional attributes from Jira issues to Coda

Each issue in the Jira Packs table is a rich reference to the actual issue in your Jira instance. When you hover of an issue, you can see all the other attributes for that issue regardless if that attribute has a value. You can add those attributes to your Coda table in case you decide to use that attribute in the future in Jira:
12jira.gif

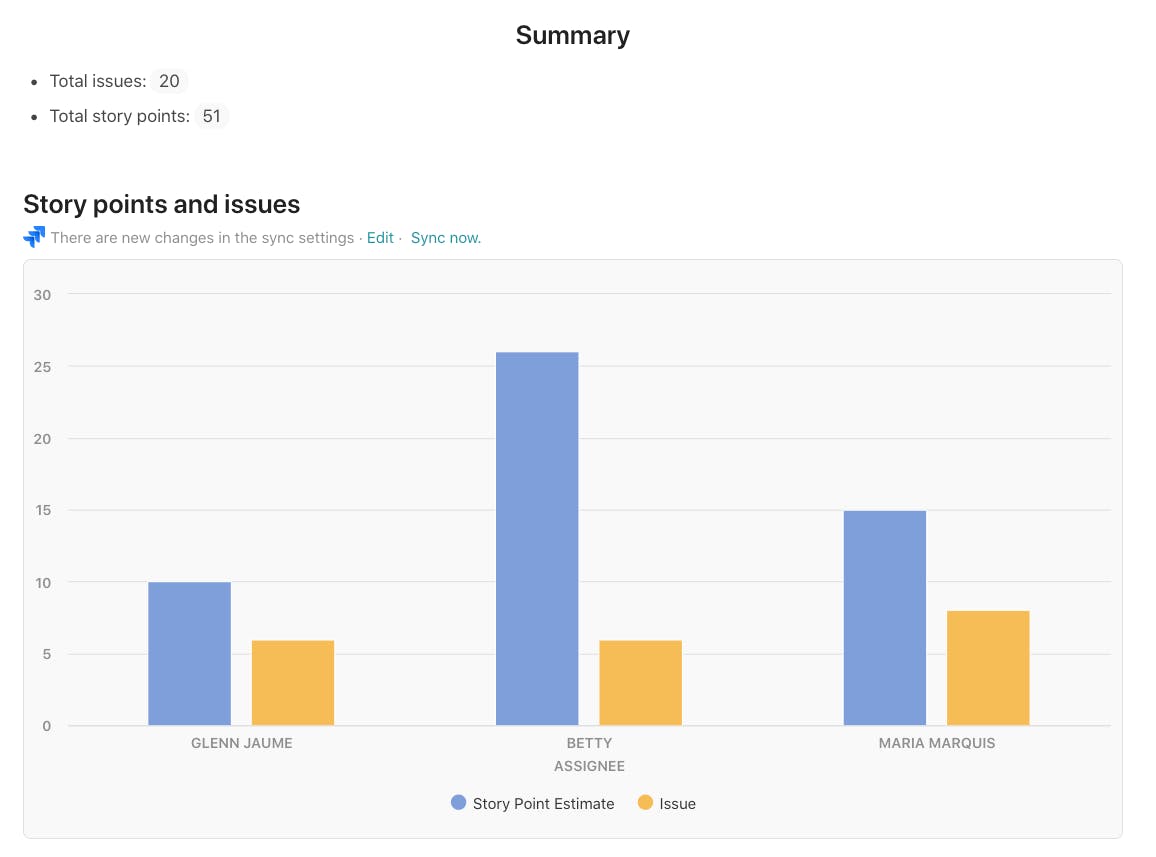
Visualizing Jira issues in Coda

Once the data is synced over, you can do spreadsheet-like things with the table. The most powerful feature for most teams’ workflows is creating views off of the main table of Jira issues. This is similar to creating multiple worksheets of the same list of issues in Google Sheets. The difference is that Coda tables and views are always connected, so any changes in one view or in the main table are automatically propagated to all other connected views. This prevents the need to use QUERY in Google Sheets or some other workaround to keep data synced between worksheets.
This view below is built off the same list of issues but grouped across two dimensions: Assignee and Status. You can see this view of Jira issues in of the template.
13jira.gif
Depending on who you select as the Assignee, a chart below updates showing the Issues and Story Point Estimate for that person:
14jira.png

Custom columns built off of Jira issues

In the Planned completion column, I want to communicate to the broader team when this issue might get fixed. Adding a custom field like this to your Jira project can be complicated, and in Coda it’s simply just adding another column. There is no formula in this column, but rather a value (eg. Q4, Q1, Q2) that my team has added after prioritizing and grooming our issues list.
15jira.gif
Once I have this column in place, I can group by this column (think PivotTable) and completely change the layout of how my data looks to a kanban board. This is another view of the same list of Jira issues but now I can move issues around from one list to another depending on when I expect the Planned completion date to be:
16jira.gif

Jira issues are in sync. Always.

The key takeaway is that my team can continue working in Jira, and any of these custom views, columns, and formulas will update automatically. Certain teams or external stakeholders may need to see Jira issues “rolled up” into some report or analysis, and Jira doesn’t provide the exact reporting you need. Those team members can see Jira issues the way they want in Coda.
Want to print your doc?
This is not the way.
Try clicking the ⋯ next to your doc name or using a keyboard shortcut (
CtrlP
) instead.