Skip to content
How to build tasks dependencies with durations in Google Sheets, ClickUp, Monday, Wrike, SmartSheet, Notion, and Coda
Share
Explore

icon picker
How to build tasks dependencies with durations in Google Sheets, ClickUp, Monday, Wrike, SmartSheet, Notion, and Coda in 2024

This tutorial shows how Google Sheets, ClickUp, Monday.com, Wrike, Smartsheet, Notion, and Coda handle task dependencies for a project.
Your project may contain tasks that depend on each other. Sometimes a task cannot start until its dependent (predecessor) task finishes, or maybe the task can start when its dependent task starts as well. As you manage tasks with these more complex (FS, SF, SS, FF), you may find more specialized software or SaaS tool to help you plan and visualize these tasks.

Goal of this post

This post doesn’t show the pros and cons of each platform, nor does it pick a “winner” that can handle this use case perfectly. Every team and project manager has their own unique use case and “.” My goal is to show how you can build and model the this list of requirements for your project’s tasks on each platform:
Task dependencies
Task end dates that factor in task durations
Task start dates that factor in the task’s dependent’s finish date (Finish-to-Start)
Automatic cascading of task dates when “kickoff” task date changes
Gantt chart and other visualization of tasks and dependencies
The way I found the different platforms and SaaS tools mentioned in this post was from simply Googling things like task dependencies software and best project management software task dependencies and seeing which tools showed up in Google Adwords and on “top 10 “ lists.
Jump straight to the video tutorial below. Open video in YouTube for timestamps to skip straight to a platform you’re interested in.
Coda template in the tutorial is in or you can click the card below:
The above bullet points don’t capture every facet of tasks and dependencies. I think most of the platforms I describe below can handle a majority of these use cases. You’ll have to explore each platform on your own to see if the platform can handle:
Your specific use case of task dependencies
Additional use cases beyond task dependencies your team may expand to in the future
With that said, let’s start with the granddaddy of them all when you’ve just launched a project and reach for the first tool you have at your disposal: Google Sheets.

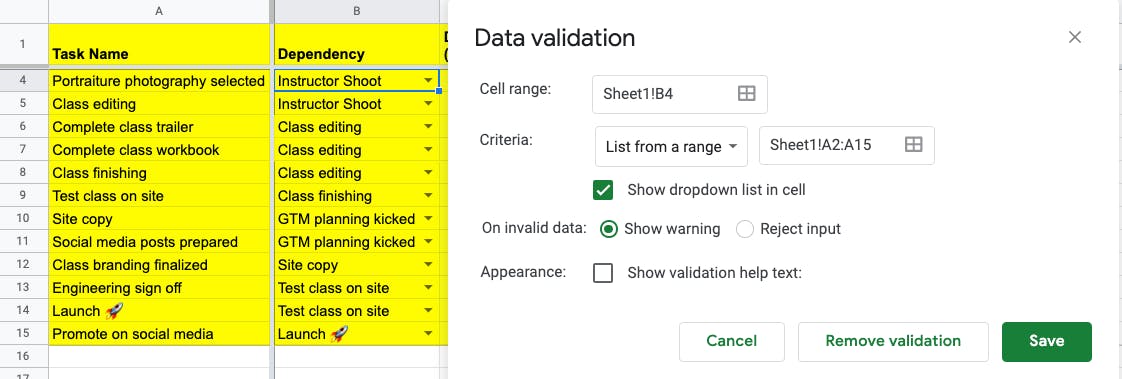
Google Sheets task dependencies
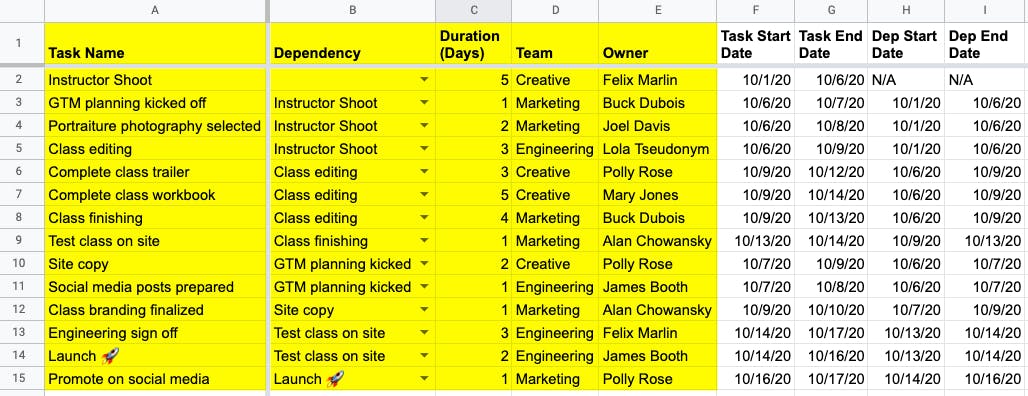
The list of tasks and dependencies in this Google Sheet will be the same list of tasks I try to replicate in every other platform. Copy the I show in this example if you want to use this for your own team.
1-google-sheets-project-management.png
Coming from an Excel/Google Sheets background, I found this task management template pretty easy to set up. With some clever uses of data validation, formulas, and conditional formatting, you can get close to how other dedicated project management platforms handle task dependencies and visualization.

Task dependencies

The Dependency column contains cells with the same (dropdown list). The list of tasks you can choose is simply all of column A (your list of tasks). Here is what the settings look like for the data validation rules for each cell in column B:
2-google-sheets-data-validation.png
Columns C, D, and E are just other attributes related to a Task Name. Task End Date just takes the Task Start Date and adds the values in the Duration (Days) column. It may not seem like a difficult formula, but you’d be surprised as to how difficult it is to get a proper date format after you’ve added a number (duration of task) to a date (task start date). You’ll see this crop up in the other platforms that don’t handle date and number format types well.

Dependency start and end dates

Dep Start Date and Dep End Date are VLOOKUP formulas that search the same table and return back columns 6 and 7, respectively:
3-dependency-dates.png
Note how the lookup value is column B (each task’s dependency).

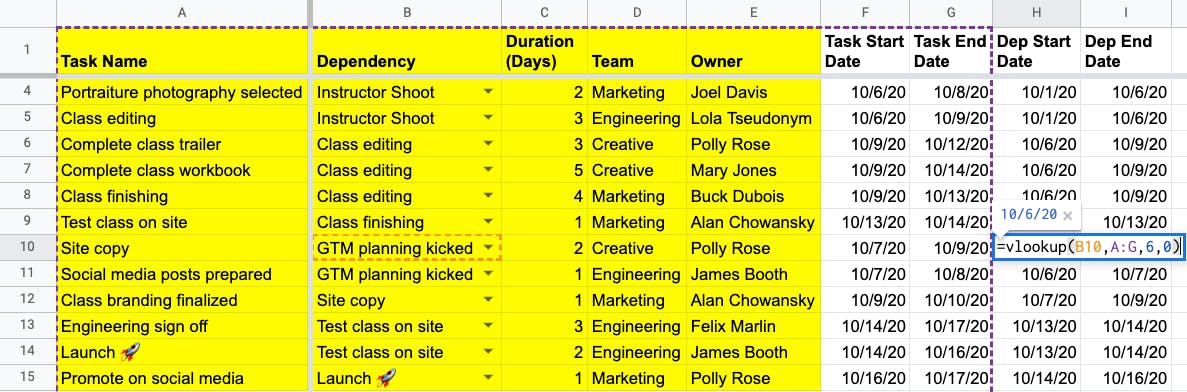
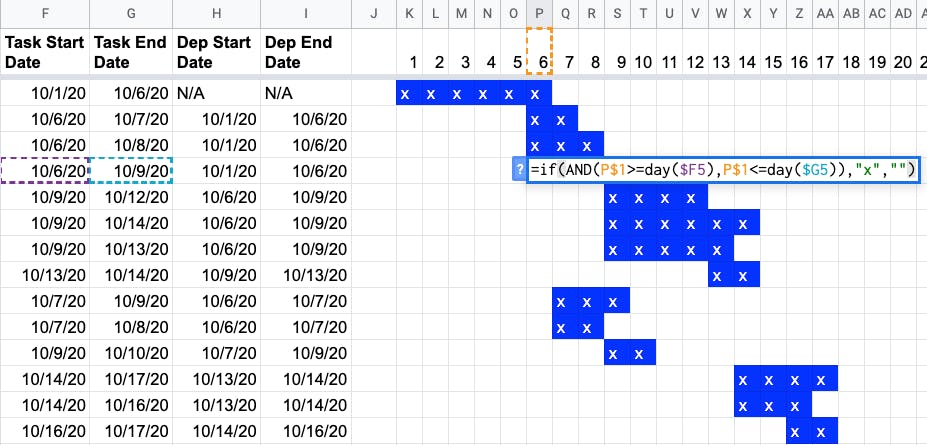
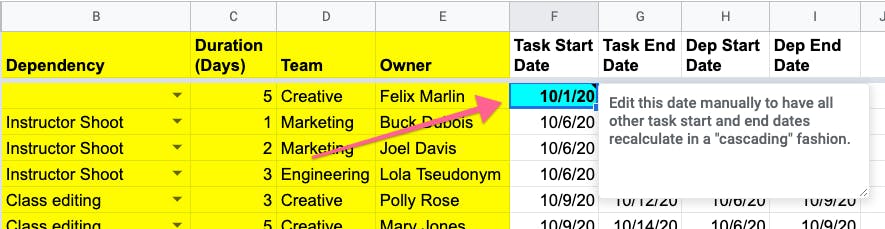
Finish-to-Start task start dates

To get each task’s Task Start Date to start when its dependent task finishes, we simply set the Task Start Date column equal to the Dep End Date column. This could lead to a recursive situation if you accidentally select a Dependency that is the same as the Task Name:
4-recursive-loop.gif

Cascading dates based on “kickoff” task start date

The “Instructor Shoot” task does not have any dependencies, and thus is our “kickoff” task. The Task Start Date for this task does not equal the Dep End Date column and is hard-coded. Therefore, when you edit that cell’s date, every other date will re-calculate or “cascade” down to reflect each task’s new start and end dates:
5-cascading-dates-recalculate-dependencies.gif
Like I said before, this is already a lot of great task dependency functionality with just a few formulas.

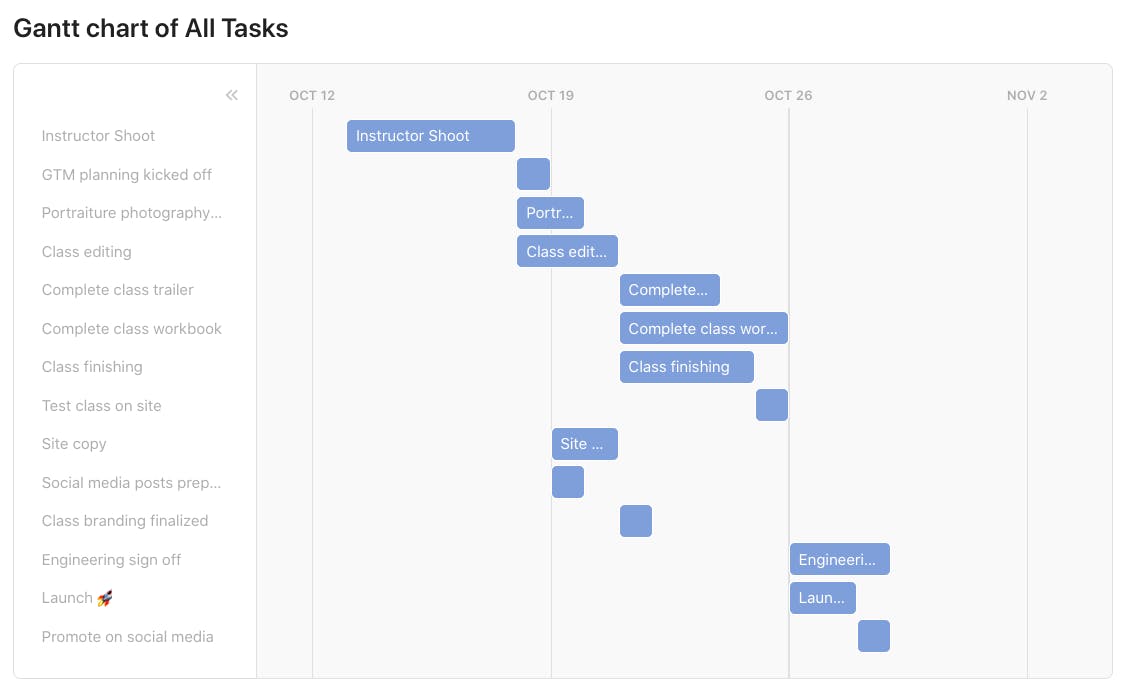
Gantt or timeline visualization of tasks

While a table view is great if you want to get specific dates for a task, visualizing these tasks on a gantt chart or some other visualization would be helpful. In order to build a simple visualization in Google Sheets, I put a number at the top representing each day of the month. You then write a formula in each cell below these numbers to see if that given task’s start and end dates day of the month falls within that range of numbers. If it does, then you just put an “x” in that cell. Here’s what that looks like:
6-gantt-chart-tasks-timeline.png
You then copy this formula for all the cells (from columns K and beyond). Then you can apply some basic conditional formatting so that you can see each of the “x” more clearly. This results in a hacky gantt or timeline visualization of all your tasks. As you change the kickoff task start date for the “Instructor Shoot” task, you’ll see the hacky gantt chart shift as well:
7-gantt-chart-tasks.gif

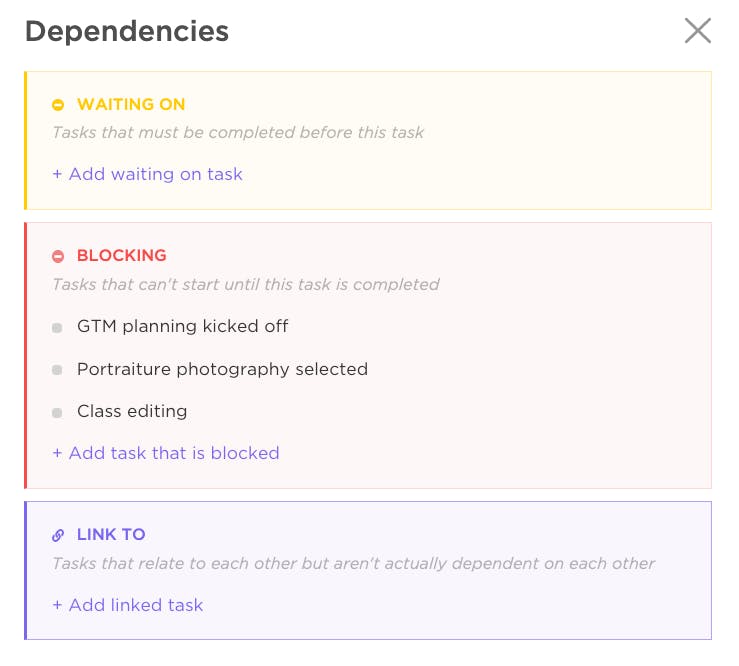
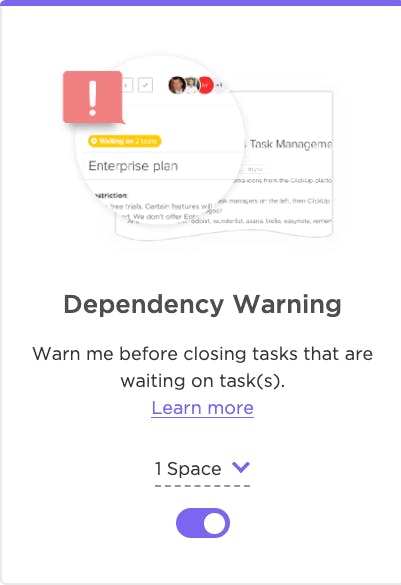
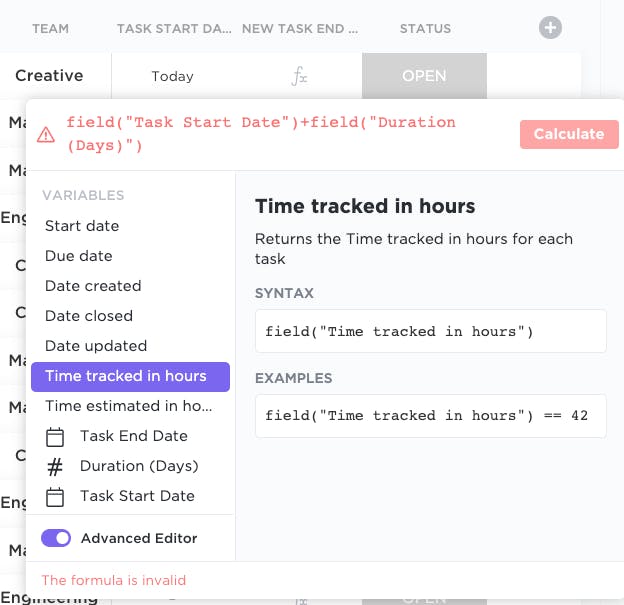
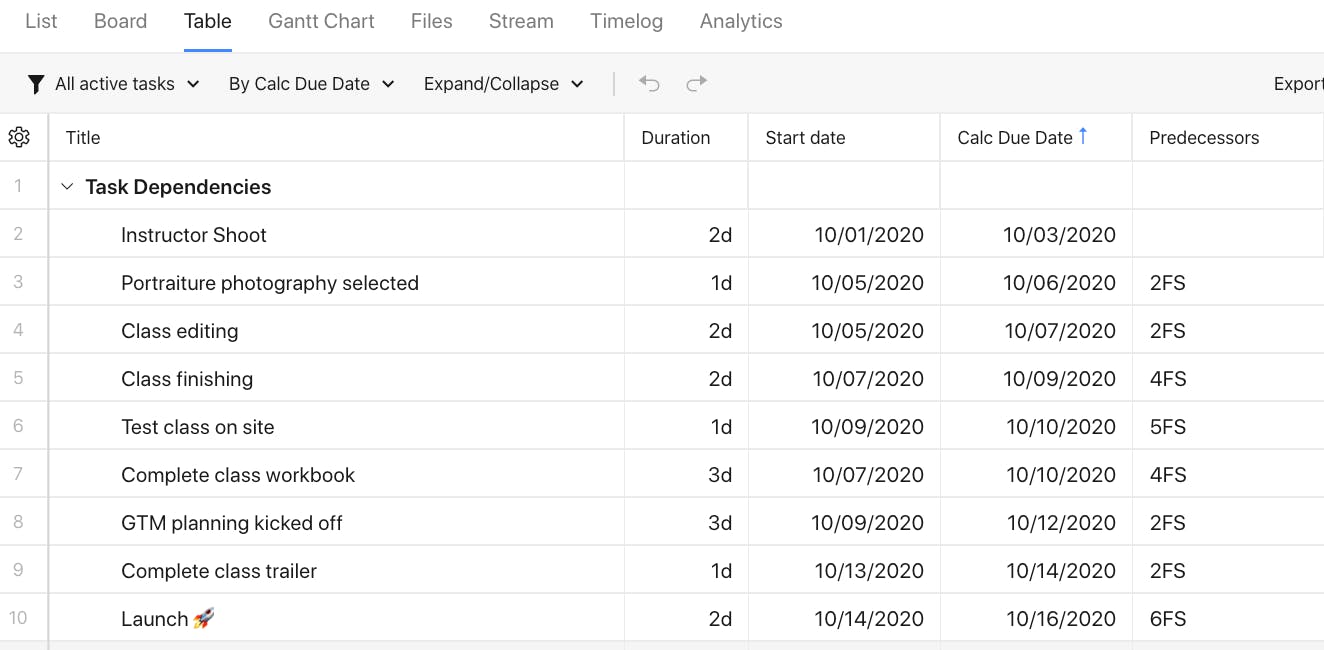
ClickUp task dependencies
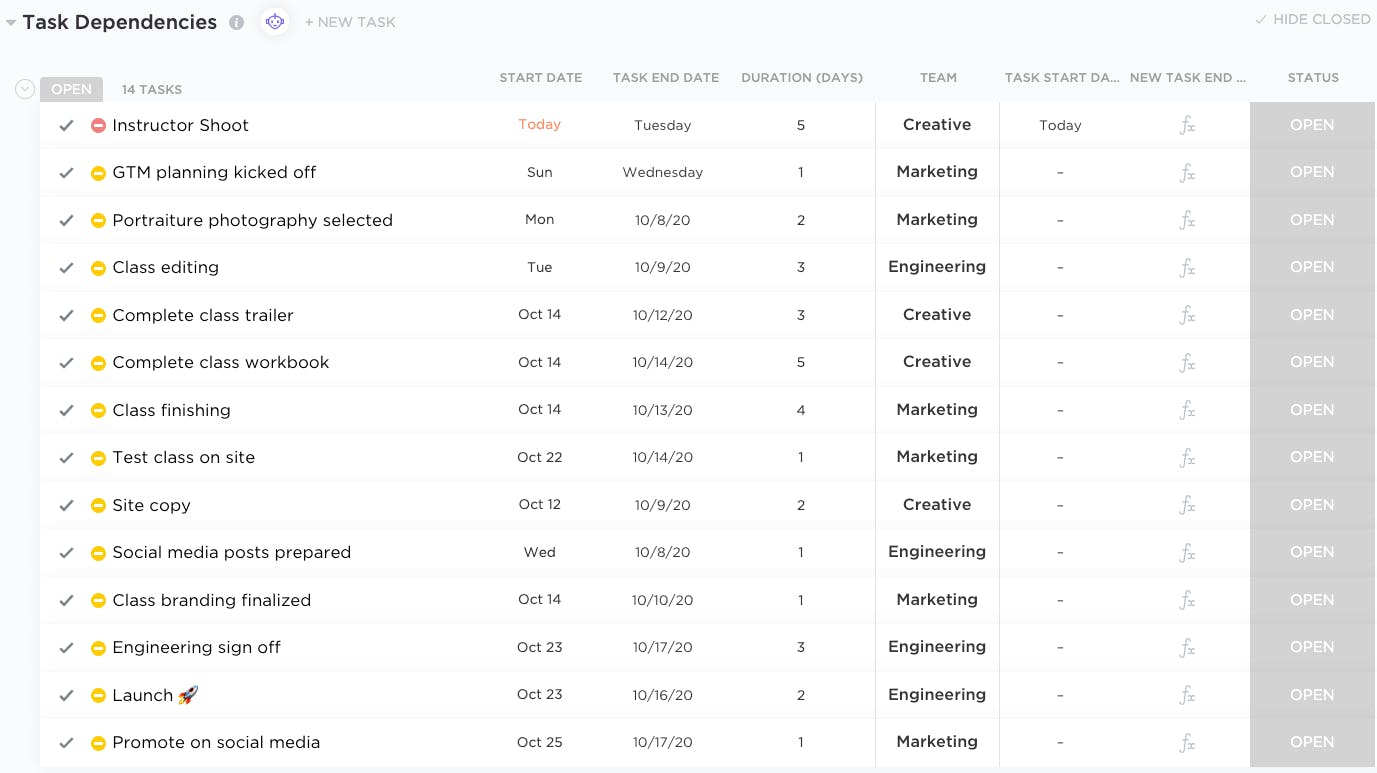
The List view in ClickUp looks similar to the Google Sheet (as in other platforms). You can sort by each column and there’s a very clear Status column for you to mark if the task is Open or Closed. This may be helpful when you want to hide all the closed tasks.
8-wrike-tasks.png

Task dependencies

In order to define each task’s dependency, you click on the 3 dots in the last “column” of the list and click on “Dependencies.” From there, you click on “Add waiting on task” to define which task this current task is “waiting for.”
9-wrike-task-dependencies.gif
The pop-up that shows the various aspects of the dependency shows some useful information regarding that task. For instance, the “Instructor Shoot” task is blocking three other tasks (this task is the predecessor or dependency for three other tasks).
10-wrike-blocking-tasks.png
This pop-up is helpful because it’s color-coded and gives you a chance to audit your task list to see which task may be blocking the most number of tasks. Of course, you’d have to manually go through each task to see which tasks that current tasks blocks. One could argue that the Gantt view lets you see this more easily (see more below).
I found this YouTube video pretty helpful in terms of explaining the importance of task dependencies overall rather than explaining how to use ClickUp itself:
One final note about task dependencies in ClickUp is that a warning pops up if you try to close a task that is still “waiting” on other tasks. You don’t want to close something before its dependencies are done, so there’s a where you can toggle this feature on. It’s a nice warning to have for when you accidentally close a task you shouldn’t have:
10.5-clickup-close-task-warning.png

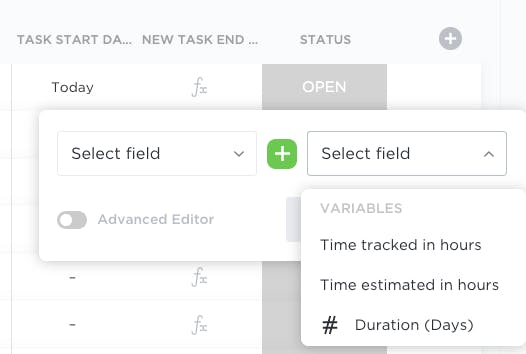
Calculating task end dates and durations

As far as I can tell, you need to manually select each task’s start date. This means you won’t get that cascading feature we saw with Google Sheets. I tried creating a Formula column to calculate a task’s end date based on the tasks’ start date and its duration (in days), and the formula editor is pretty basic:
11-wrike-basic-formula-editor.png
You can switch to the “Advanced Editor,” and start selecting other columns to create a more custom formula. My hunch for why this formula doesn’t work is because the Duration column is a number column format and you’re trying to add this to a Date column format.
12-wrike-advanced-formula-editor.png
Here’s the first instance where we see column formats getting in the way of writing a formula, which Google Sheets handles pretty seamlessly.

Gantt visualization

I’ve found that most project management platforms have pretty robust visualizations of your tasks and dependencies. They just work right out of the box. In ClickUp, arrows show which tasks are dependencies of other tasks with these arrows (which you can drag-and-drop):
13-wrike-gantt-chart.gif
For more complex projects, you can also toggle “Critical Path” and “Show Slack Time” to see this laid out on the gantt chart:
14-wrike-critical-path.gif

Monday.com task dependencies

My free trial of Monday expired before I could take screenshots 😃, so watch the video starting around 13:15 to see the walkthrough:

Task dependencies

gets you pretty far with setting up task dependencies.
I was able to get pretty close to replicating the functionality of Google Sheets, but ran into similar issues as ClickUp in terms of being able to calculate task end dates and task dependency end dates. My guess is that it also has something to do with the date formats mixing in with various other column formats in the Table view in Monday. The reason is I had to start using a column type with the column type to “project out” the dependency’s start and end dates. Now you’re mixing dates, numbers, Link to Item, and Mirror column types which didn’t work out so well for the formula I was trying to build.
As far as I can tell, you still need to set each task’s start date manually in order to get a calendar and gantt chart view that is useful for your team to look at. A nice error check (similar to the warning message when you close a dependency in ClickUp) is an Automation rule that prevents from you from setting a task start date before that task’s dependency is done. This type of error check doesn’t need to exist in the Google Sheet because all the task start dates are formulaic and are dependent on each task’s predecessor.

Wrike task dependencies

The table view in Wrike looks similar to ClickUp and Monday, but is starting to feel a little more spreadsheet-y. I didn’t include all the columns from the Google Sheet for simplicity’s sake. I easily copied and pasted from the Google Sheet into the table view in Wrike to build a similar looking table as Google Sheets. You’ll notice the different “tabs” at the top to quickly switch to a different view of your task list:
15-wrike-tasks-list.png

Task dependencies

Unlike Google Sheets, ClickUp, and Monday, Wrike takes a more traditional project management approach to defining a task’s dependency or predecessor. You’ll notice in the Predecessors column there are numbers and text like “2FS’ and “4F.” The number represents the row of the dependency and the “FS” is “Finish-to-Start” .
You actually can’t edit the Predecessors column in the table view, only in the Gantt Chart view here:
16-wrike-gantt-chart.png
Similar to ClickUp, you can drag-and-drop the bars in the Gantt chart view to change the dates of a given task and draw arrows to other tasks to create new dependencies:
17-wrike-gantt-dependencies.gif

Cascading dates based on “kickoff” task

While you can pinpoint the dependency with the row number for each task and whether it’s a “FS” or “SF” dependency type, I don’t believe the start dates and durations cascade “down” similar to the functionality I built in Google Sheets. Based on this , it appears the only way to do this is to hold the SHIFT key to move an entire “dependency chain” forward or backward in time. I think having a WYSIWIG editor on the Gantt chart view to achieve this same functionality would be a nice to have.
I was able to create this Calc Due Date column which simply takes the task’s Start Date and adds the Duration to it. The Calc Due Date column is a custom field that is a Formula type:
18-wrike-custom-formula.png

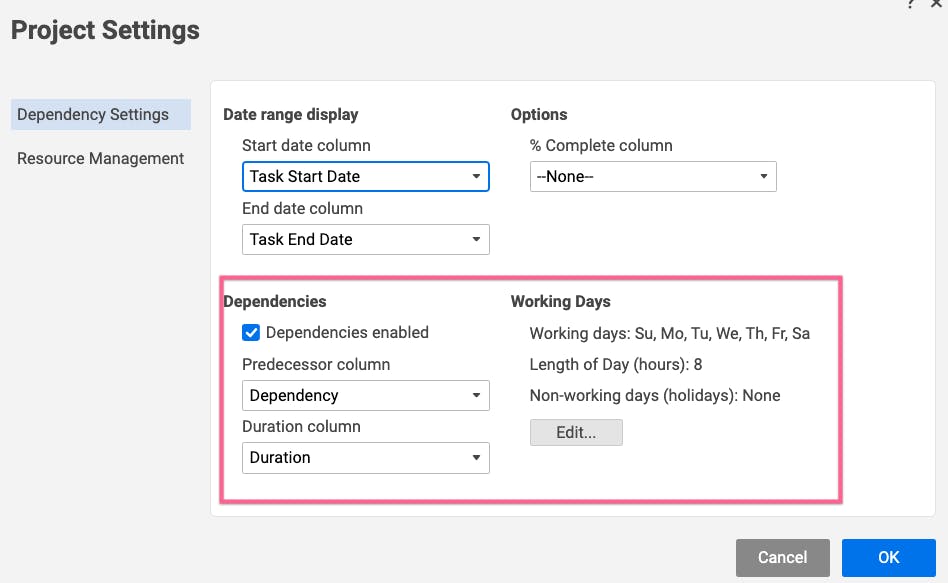
Smartsheet task dependencies
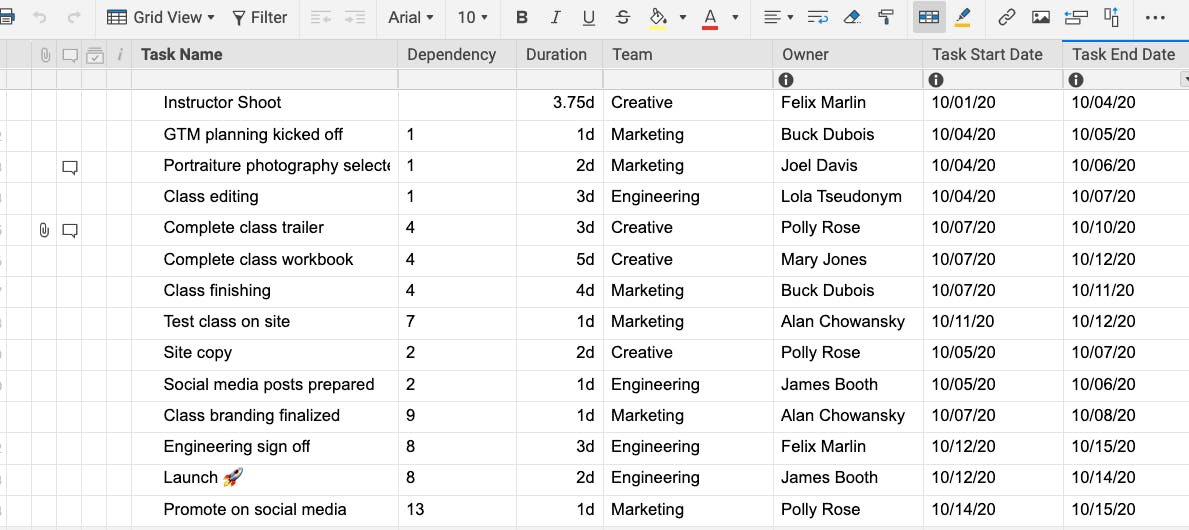
Smartsheet is one of the more well known dedicated project management platforms out there. Their software looks and feels more like a spreadsheet than the other previous platforms (the “sheet” in their name might have been an indication). The grid view looks just like a spreadsheet with some “sticky” columns to the left for attachments, comments, and other attributes for a given task.
19-smartsheet-tasks.png

Task dependencies

To incorporate dependencies for each task, you have to go to the Project Settings and explicitly enable Dependencies. Through these settings, it’s clear that Smartsheet has iterated over the years to provide users with a defined set of options when it comes to setting dependencies.
This has its tradeoffs. On one hand, you have this very powerful piece of software that does task dependencies really well and you know that they have thought about all the edge cases related to dependencies and due dates. On the other hand, you lose some flexibility (that you get with a Google Sheet) in terms of defining your own dependency “rules” and “project settings.” This decision to go with an opinionated piece of software like Smartsheet versus building something yourself goes beyond project management and task dependencies.
Ok rant over 😃. Let’s get back to Smartsheet. Once you’ve enabled dependencies, you need to select the column for your Predecessor as well as the column for Duration. I already have a column for Duration (which came from the Google Sheet) and I created a column called Dependency. This also walks you through how to work with dependencies in Smartsheet in detail.
20-smartsheet-project-settings.png
Similar to Wrike, you put the row number in the Dependency column for the task that is the dependency for that current ask. To get more specific with each dependency, you can click on the pencil icon to open up more settings for that dependency. Here is where you can define a more specific dependency type (e.g. SF, FF, SS):
21-smartsheet-dependency-types.gif

Cascading dates based on “kickoff” date

Unlike Google Sheets (or any of the other dedicated project management platforms so far), I didn’t have to create separate columns for a dependency’s start date or end date. Smartsheet automatically re-calculates the Task Start Date and Task End Date based on the date you select for your “kickoff” task (in this case “Instructor Shoot”). This is a nice built-in feature that removes the need for you to do a VLOOKUP in Google Sheets or struggle with creating a custom formula in ClickUp, Monday, or Wrike:
22-smartsheet-recalculate-dates.gif
You also get an error message if you try to change the Task Start Date for any task that has a dependency. We see similar error checks in ClickUp and Wrike:
23-smartsheet-change-predecessor-dates.gif

Gantt chart visualization

The gantt chart view is pretty similar to the other project management platforms. You can’t adjust the task start date (left side of the bar in the gantt chart) because you’ll run into the same error as beforeーmessing with a task’s start date means it will break the “chain” of dependencies/predecessors. The view doesn’t look that far off from the hacked up chart I was able to build in Google Sheets:
24-smartsheet-gantt-chart-view.png

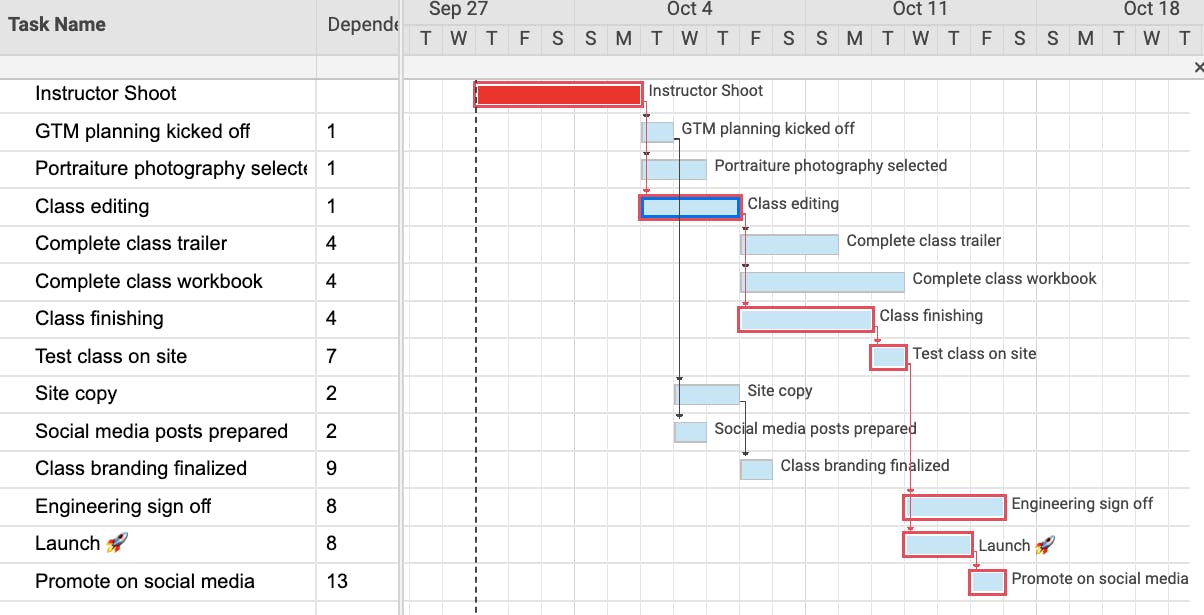
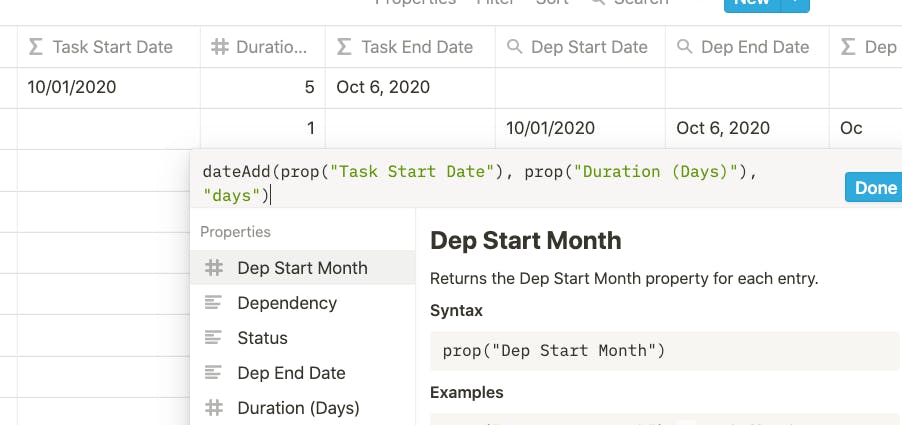
Notion task dependencies
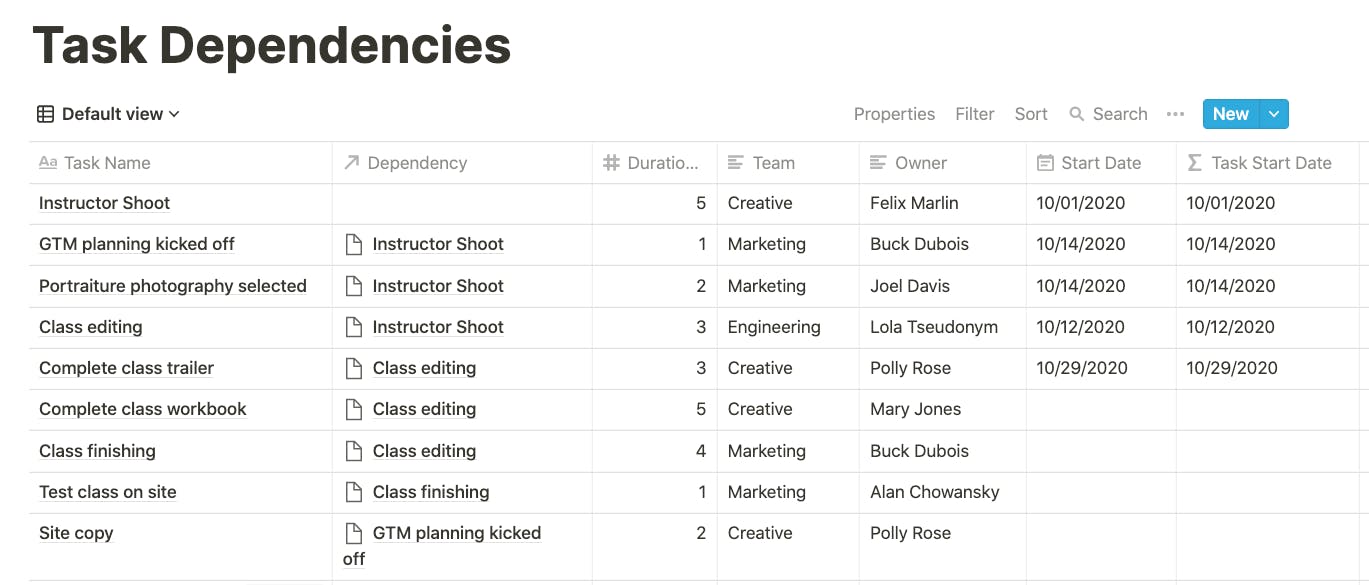
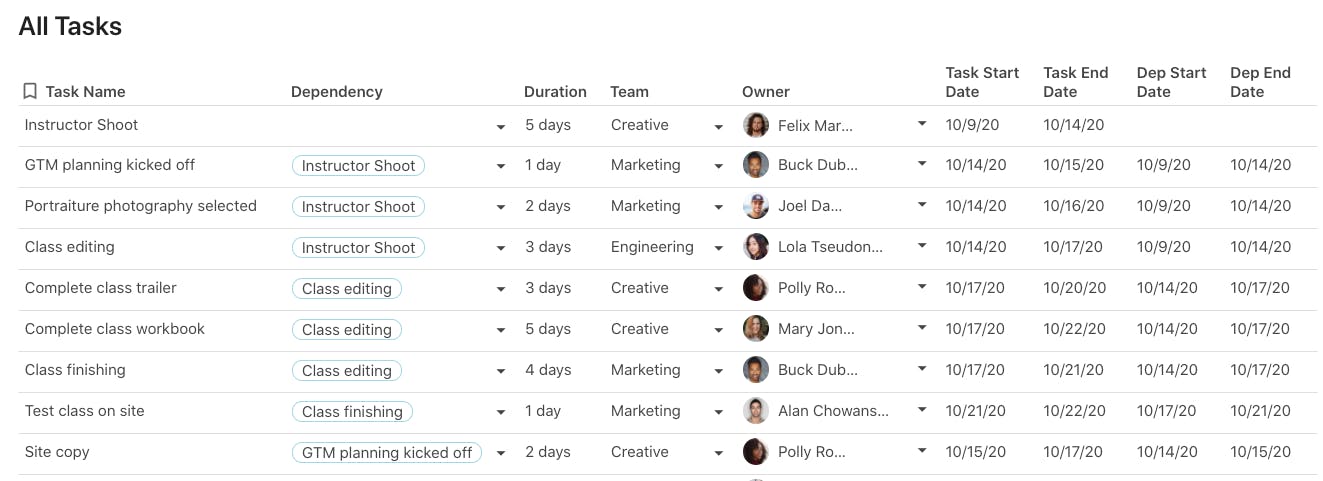
Tables in Notion act similar to the list/table views in ClickUp, Monday, Wrike, and Smartsheet in that the columns have specific types. This will lead to issues down the line because I try to mix column types in the formulas I write. Aside from this limitation, the table looks and feels like a spreadsheet and I was able to easily copy and paste into the table from Google Sheets:
25-notion-table-of-tasks.png

Task dependencies

The Dependency column is a column type in Notion. This column type lets you “lookup” to other tables in your workspace, but you can also lookup to the same table. This is pretty similar to the data validation in Google Sheets. I can now select any task from the first column as the Dependency in the second column.
26-notion-pick-task-dependency.gif

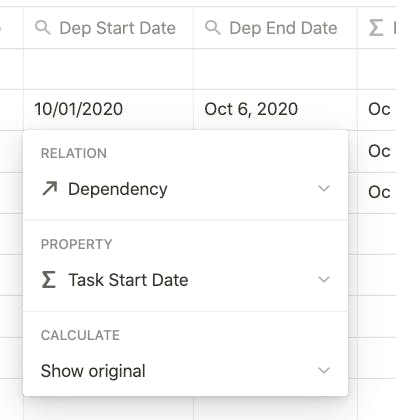
Task and dependency start and end dates
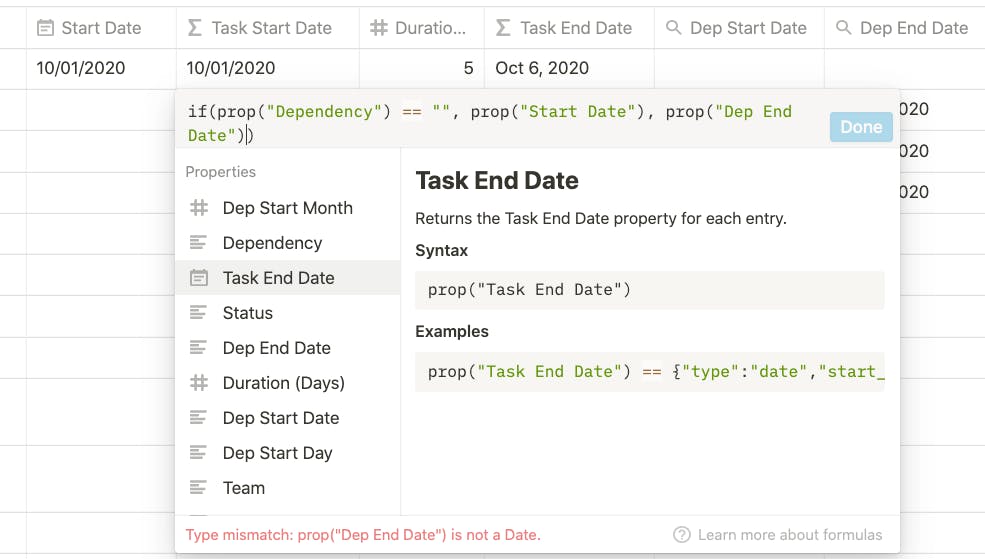
Notion also has a formula language and I was able to create a Task End Date similar to what we have in Google Sheets. It’s simply Task Start Date plus the Duration. You can use the dateAdd function in Notion to make this work:
27-notion-add-duration-to-dates.png
In the Google Sheet, the Task Start Date needs to be built off of the Dep End Date column in order to get the “cascading” date effect when you select the date for the “kickoff” task. I started building out the Dep Start Date and Dep End Date columns by using a column type. This allows you to “project” the task start and end dates for a given dependency:
28-notion-rollup-column.png
With the Dep Start Date and Dep End Date, we’re getting close to mimicking the Google Sheets structure. Then came the issue of trying to build the formula for the Task Start Date. In the screenshot below, you’ll notice that there’s a “Type mismatch” error which leads me to believe that the Rollup column type in the Dep End Date column is messing up the formula:
29-notion-calculate-dependency-end-date.png
This formula looks to see if there is anything in the Dependency column. If that column is blank (which is the case for the “Instructor Shoot” task), then it just shows the value in Task Start Date. This is the date we want to use to “cascade” the dates down the table. If the Task End Date column was a date format type, I think this formula would work since that column affects the Dep End Date column. I tried looking at a few articles discussing date functions
,
, and
, but couldn’t figure out a solution. If you find one, let me know!
After writing into support, I found out the Task Start Date formula I’m trying to write could potentially lead to a recursive loop situation, and that Notion formulas don’t currently support this type of use case. Similar to ClickUp, Monday, and Wrike, it looks like you have to manually enter in each task’s start date to build a proper view of your project. This YouTube video below also shows how to build dependencies which resembles the “waiting” and “blocking” concept in ClickUp:

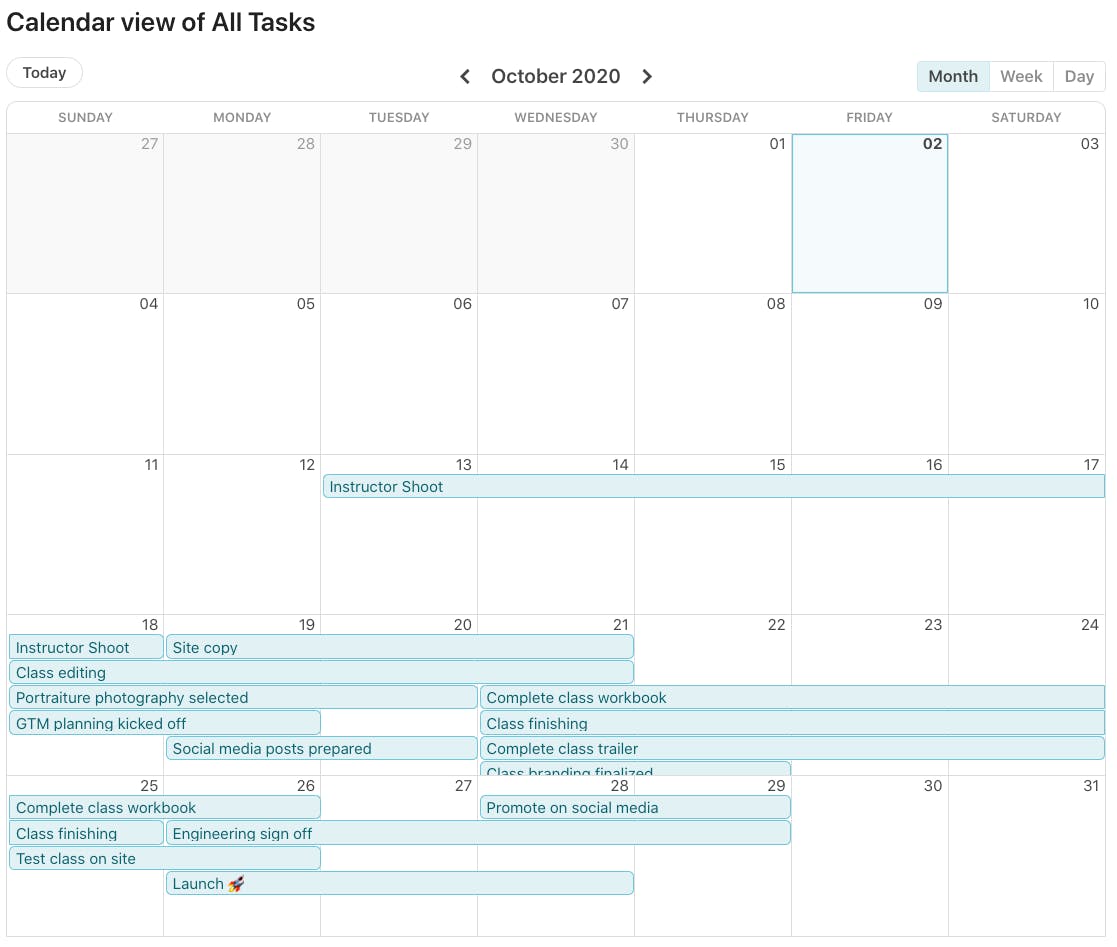
Calendar visualization

I believe there is a gantt charts are still on Notion’s roadmap, so the only native view that would make sense for this project is the Calendar view. You can easily switch to this view by clicking the dropdown near the top-left of the table:
30-notion-calendar-view.gif

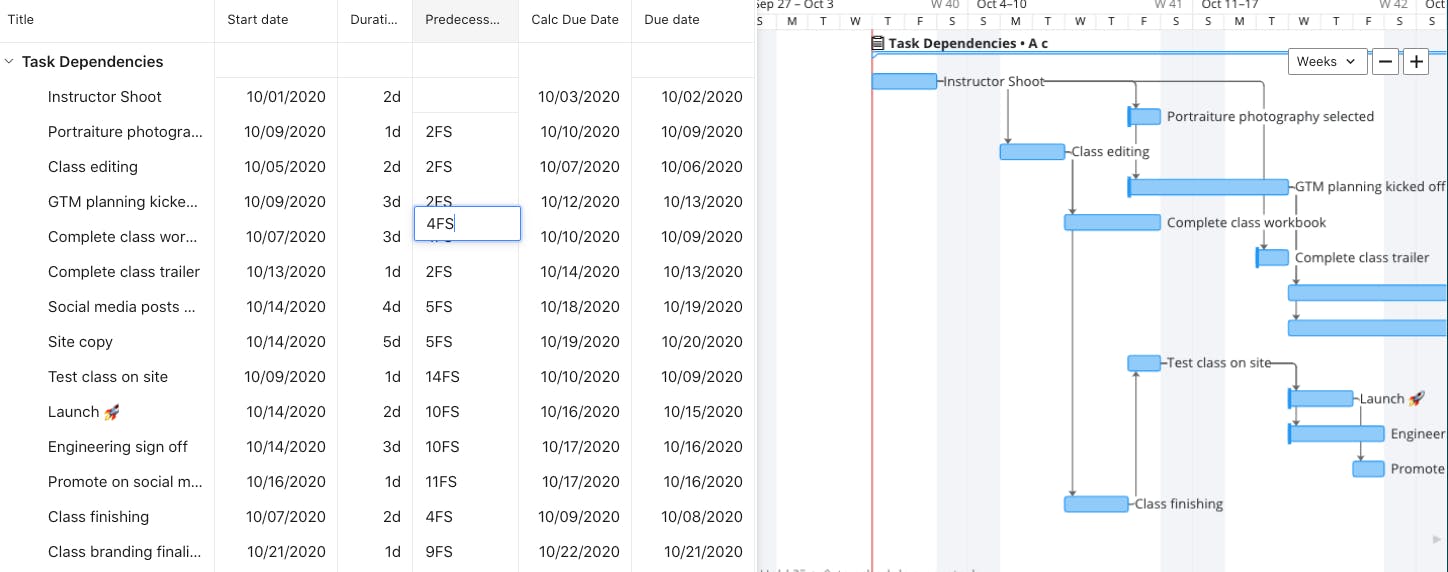
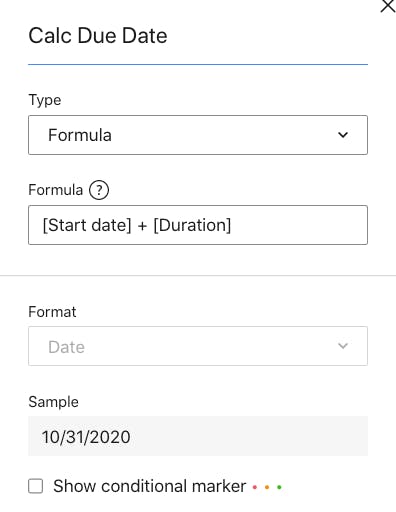
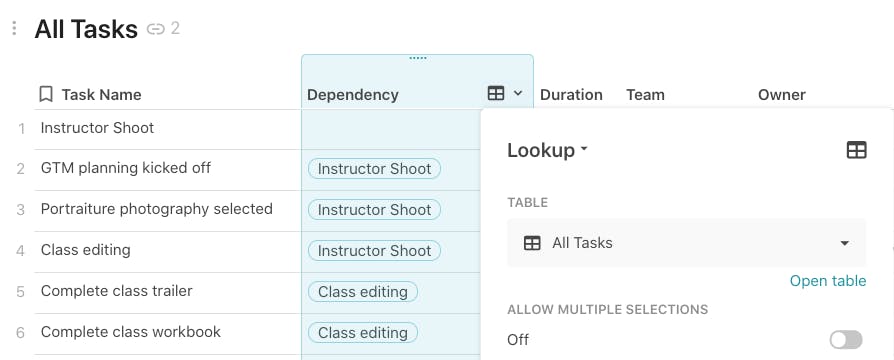
Coda task dependencies

Disclosure: I work at Coda.
Tables in Coda are similar to the “list” view in ClickUp, Monday, Smartsheet, and Wrike in that columns have specific format types. If you accidentally put a number in a text column, however, it’s not the end of the world and Coda won’t give you an error message. Formulas in Coda tables also get applied to the entire column (not just that specific row like in Google Sheets). You can see the actual template in or follow the screenshots below.
31-coda-tables.png

Task dependencies

Similar to Notion’s Relation column type, Coda has a that lets you “lookup” to another table in your doc or to the current table the column is in. In this case, the Dependency column is a lookup column to the “All Tasks” table:
32-coda-lookup-columns.png
Now I can select any task in the Task Name column as the dependent task in the Dependency column. Also similar to Notion, hovering over each value in the dropdown actually lets you see all the data related to that specific task:
33-coda-task-dependencies.gif

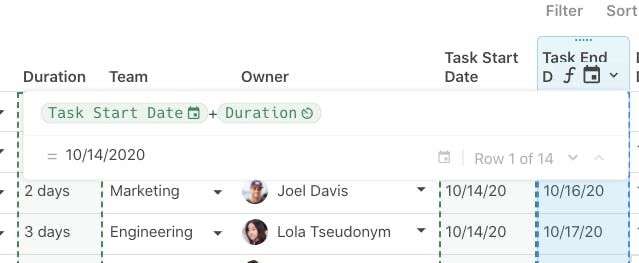
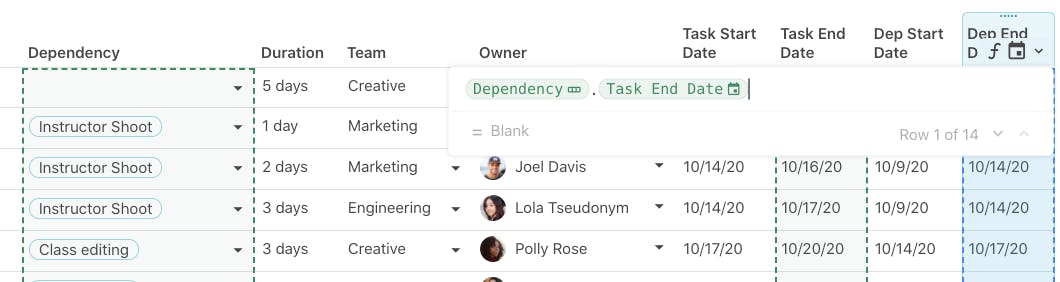
Task/dependency start and end dates

In some of the project management platforms described above, writing formulas led to errors due to inconsistencies with column types. Notably, being able to add a number (from our Duration (Days) column) to a task’s start date is problematic since you are mixing date and number formats. Smartsheet handles this well given that it has strict rules around dependencies and task durations. Notion also is able to handle this scenario with their dateAdd function.
In Coda, the Duration column in our table is actually a custom duration column type. This means if you enter the number “3” in this column, the column will automatically convert that number to “3 days.” Therefore, adding Task Start Date with Duration yields another date as shown in the formula below:
34-coda-task-end-dates.png
If you recall in the Google Sheet, we were able to add the task’s start date with a number and Google Sheets automatically converts the number to the “number of days” that task is supposed to take. No issues with mixing and matching column formats. Since Coda formulas apply to the entire column, you can use the name of the column in the formula instead of a specific cell reference (e.g. “D5”).
To get the dependency’s start date and end date like we have in the Google Sheets, we can simply reference the Dependency column and “project out” it’s start and end dates like so:
35-coda-task-dependency-start-end-dates.png
The Dependency column contains the entire “row” of a given task in the first column of our table, so each column in this table is bound to whatever task you select in the Dependency column. This is similar to the Google Sheet where we do a VLOOKUP onto the same table to find the dependency task’s start and end dates. One could argue that the Coda formula is a bit easier to read since you don’t need to input a bunch of values or references into the formula.

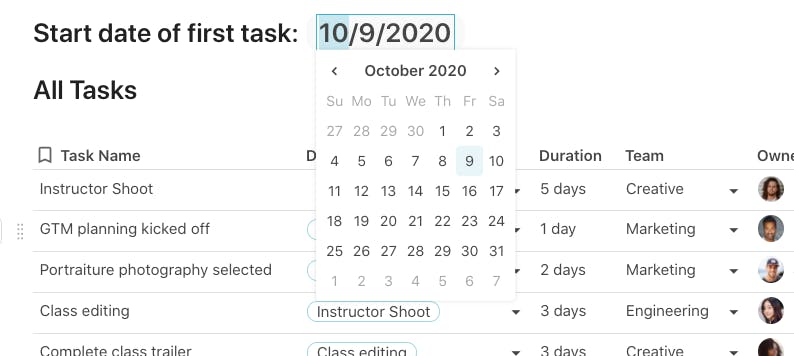
Cascading dates with a “kickoff” date

Coda accounts for potential recursive situations, so you’re able to create this “cascading” list of dates similar to the functionality we have in the Google Sheet. In this case, I give the user the ability to input their own start date for the “kickoff” task (”Instructor Shoot”) as a date picker right above the table:
36-coda-select-dates.png
This date picker is a which you can assign a name to (similar to defined named ranges in Google Sheets). I named this date picker firstTaskDate which we’ll use in a formula in our table.
When I select new dates in the firstTaskDate date picker, you’ll see all the task and dependency dates automatically re-adjust based on the start date of the “Instructor Shoot” task. This is similar to adjusting the first hard-coded start date in Google Sheets, moving the “dependency chain” in Wrike, and shifting the gantt chart in Smartsheet:
37-coda-cascade-task-dependency-dates.gif
This all works because of the formula in the Task Start Date column. This is a formula I was not able to replicate in other dedicated project management software due to a mismatch in column format types and the potential for a recursive formula. The formula is an IF statement that checks to see if the Dependency column is blank. If it is, then it uses the firstTaskDate date picker value right above the table as the date for the “kickoff task.” Otherwise, it just takes the value in the Dep End Date column. We are modeling a simple Finish-to-Start scenario but we could easily write a more custom formula to account for SF, SS, and FF dependency types.
38-coda-task-start-date-formula.png
The formula in Google Sheets is easier because we can simply reference the Dep End Date column without having to write an IF statement. But this comes at the cost of giving the user a clean user input to pick the date for the “kickoff” task. In Coda, it’s a date picker that goes right above the table with some helper text before it. In Google Sheets, you would have to format the hard-coded cell and perhaps put in a note for the user to know that this is the specific cell that the user needs to edit:
39-google-sheets-user-input.png

Gantt and calendar visualizations

Similar to other platforms, you can visualize a list of tasks and dependencies in different ways that make sense for how your team operates. The gantt chart view is not as robust and feature rich as ClickUp, Monday, Wrike, and Smartsheet. You cannot draw arrows from one task to another nor can you adjust task lengths by simply dragging and dropping the right and left boundaries of a bar on the chart. The reason for this is because each task’s start and end dates are fixed via formulas, so the tradeoff here is being able to have the “cascading” ability of dates (like you have in Coda and Google Sheets) versus the flexibility of editing each task’s dates one-by-one (as you have in ClickUp, Monday, and Wrike):
40-coda-gantt-chart-tasks.png
It’s a pretty bare bones gantt chart, but similar to other platforms you can hover over each bar and see all the data related to that specific task. When you adjust the date of the “kickoff” task, you’ll see the gantt chart automatically adjust because all these views are tied to each other.
The calendar view is pretty similar to all the other tools and similar to the gantt chart, is connect to your main table of tasks and dependencies:
41-coda-calendar-view.png

Conclusion

There are many other SaaS tools, platforms, and project management software I did not cover in this tutorial. Notably, Microsoft Project is something that came up during my research that I know many project management professionals have used for years to manage tasks and dependencies.
As I stated the top of this post, there is no “winner” that you can walk away with from this tutorial. Unlike other “top project management software” blog posts where you get a cursory view of each software’s pros and cons, this post explores the idiosyncrasies of task dependencies which may not even be relevant to your project. If you’re in the process of researching software and you need the software to accomplish a very specific task for your team, you’ll unfortunately have to dig deep into the software to see if it does what you want it to do. Entire teams at large companies are dedicated to vetting these feature sets because once you’ve selected the software, the switching costs can be very high.
If you’ve read this far, hopefully I’ve helped you comprehend a nuance about each platform in relation to task dependencies. You’ll have to do additional testing on each platform to figure out if the platform is able to accomplish some other specific task related to how your team operates and the requirements of your project.
If any part of the tutorial above doesn’t look correct, .

A few of the 40,000+ teams that 🏃‍♀️ on Coda.

image.png
Coda is an all-in-one doc for your team’s unique processes — the rituals that help you succeed. Teams that use Coda get rid of hundreds of documents, spreadsheets, and even bespoke apps, to work quickly and clearly in one place. This template is a Coda doc. Click around to explore.
Find out how to Coda-fy your rituals.

Want to print your doc?
This is not the way.
Try clicking the ⋯ next to your doc name or using a keyboard shortcut (
CtrlP
) instead.