Skip to content
How to Build a Product Plan in 15 Minutes [+Templates]
Share
Explore

icon picker
How to Do Product Planning in 15 Minutes [+ Templates]

Building your own product plan example is easy in Coda. With this product plan template, you can quickly view your team’s resource allocation across various product features.
You have a team of designers, engineers, and product managers who are ready to work on a new product launch. The first thing you might do is consult a product plan or product roadmap. With this product planning example, you can save a lot of time and resources from having to buy expensive software for managing your team’s resource allocation for getting your product out into the market.
If you want to get started right away with the strategic planning and roadmap, copy and sign up for Coda. Watch the video below on how to work on product planning from scratch with a template from Coda:

What Is A Product Plan?

At product plan (or roadmap) provides the guiding strategy for your product launch and details the work required to develop a product concept that will answer target customer needs. The product roadmap helps keep development teams on track, making it possible to evaluate how new features and functionality will impact already planned work.
product roadmap in a timeline chart in Coda
product roadmap to guide your product plan in Coda
If you read my previous post about picking , you’ve probably noticed I prefer to build my applications rather than work within the constraints of a piece of software. Nothing is wrong with purchasing project management software that does one thing really well. But let’s be real, business plans pivot on the fly, often to comply with the ever-changing market requirements. So, why not use something that is customized for your product lifecycle?
Instead of relying on someone from the software company’s support desk to help you tweak something about the software, let’s see how we can complete the fundamental product planning steps in 15 minutes or less in Coda. The 3 main tables we need to build to streamline new product development are:
People — Stores all the people on our team and their roles/skills
Features — All the product features we will build to meet end-user needs
Resource Allocation — How our people will be staffed to work on the new product ideas and features

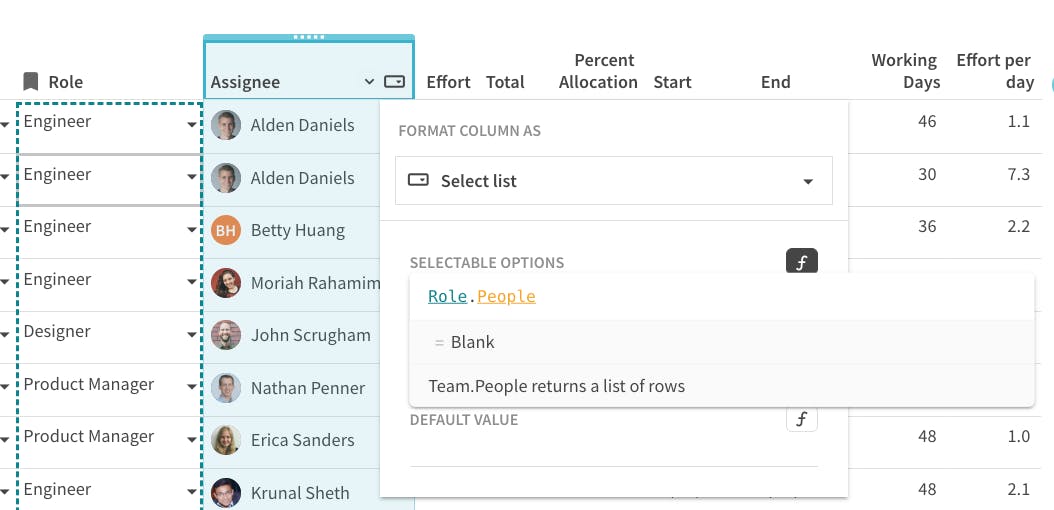
How to Assign Roles to Team Members

Before we start with the product development planning process and get into features, , and effort, we need to identify the stakeholders who are going to be involved in product planning and development process. This probably means a mix of Engineers, Designers, and Product Managers.
assign roles to key team members and stakeholders in your project
In the table above, I have 3 columns: People, Role, and Skills. The People column is a People in Coda allowing you to select all the product team teammates in your domain. Where does the Role select list that contains the options Engineer, Designer, and Product Manager come from? I created a separate “Team” table that just has those 3 options as the :
view all team members within a team for your project
You’ll notice that the People column in the “Team” table contains all the team members from my “People” table correctly assigned to their respective roles in the product planning process. The formula in the People column of the “Team” is:
=Lookup(People, Role, thisRow).People
This formula does a lookup to the “People” table, finds the rows where the Role in the “People” table matches the current row in the “Team” table, and returns the People column. It’s kind of like doing a VLOOKUP in Excel except you can return multiple values from your Lookup table instead of just one value. The Skills column in the “People” table lets you select what skills your teammates are good at. Here is where the “Skills” column comes in:
list of skills to assign to your team members
Now that we have the basic tables for our team (“Team”, “People,” and “Skills”), it’s time to build out two more tables: Features and Resource Allocation. Then we’ll have the tables we need to create our own product roadmap application that is flexible and customizable to our team and product launch.

How to Manage Features In Your Product Plan

This is the main list of where your team can store all the specific product features you want to build and launch a successful product into the new market. Some of the columns we are going to add to our product planning doc include:
Feature
Description
Lead (person)
Start Date
End Date
Working Days
Effort
Effort Per Day
Assignees
You don’t need to have all these columns in your final product plan, but you may find some of these columns useful depending on how you want to track resource allocation and approach to decision-making. Here’s what our final Features table looks like:
view of all features your product team is working on built in Coda
The Feature and Description columns are in the Text format so you can enter free-form text here. We will revisit the Lead, Effort, Effort per day, and Assignees columns after we talk about our “Resource Allocation” table. A few things to note about the “Features” table:
figure out resource allocation for each feature or task by setting the start and end dates for the task
Start and End represent the dates when the features should begin and end working. These columns are in the Date format which opens up the date picker to let you select the appropriate dates for your feature.
Working Days is a table formula that calculates — you guessed it — the number of business days between the Start and End dates. The formula is used to get this number. This is one of my favorite formulas since it excludes weekends from the calculation.
Let’s move on to our final table in our product planning document: Resource Allocation.

How to Determine Effort Score: Story Points Vs. Hours

This is an in the agile world, and we don’t have an opinion on which methodologies you use to estimate work for your team. The great thing about building your own product planning app: you can pick whatever method of work estimation and forecasting you want.
Our “Resource Allocation” table should do a few things:
Assign a team member to a specific product feature (from our “Features” table)
Estimate the work effort required for each person on the team (story points, hours, etc.)
Visualize start and end date timeframes for each person working on a feature
As you can imagine, this table is tightly integrated with the “Features” and “People” tables. Here’s what our final “Resource Allocation” table looks like:
view resource allocation across all product features in a table in Coda
This looks like a pretty basic product planning table, but let’s dive into each column to see how this table connects with the “Features” and “People” tables to give you a management tool that just makes sense.
linking your resource allocation table with the table of features using lookup columns in Coda
The Feature column is a format that connects to the “Features” table. Once you create this column, you can select any of the features in the “Features” table. Want some more context about that specific feature? Just hover your cursor over the feature and you’ll see all the other columns from the “Features” table (e.g. Description, Start, End, etc.)
The Role column is also a lookup, but it references the “Team” table we created when we created the “People” table. If you recall, the “Team” table also has a People column in it, so we can reference this column by writing the formula =Role.People. We use this formula in the Assignee column here:
setting up the assignee column using the people column format in Coda
This means all the team members who have a job title of Engineer in the “Team” table will show up as selectable options in the Assignee dropdown:
add the ability to select your team members in a column in Coda

Finally, let’s take a closer look at some of the other columns like Effort, Start, and End. Since our first column — the Feature column — is a lookup to the “Features” table, we can also reference other columns from the “Features” table like Total Effort, Start, End, and Working Days simply by starting our formula with =Feature...
finding the total effort for a product feature by using formulas in a table in Coda
If we revisit the “Features” table now and look at the Effort column here, you’ll notice it references the “Resource Allocation” table in order to sum up the effort associated with a feature with the following formula:
=[Resource Allocation].filter(Feature=thisRow).Effort.Sum()
summing up the effort required using custom formulas in a table in Coda
The Features.Effort column is also used in the “Resource Allocation” table as well (see the previous gif). You just built some pretty complicated logic to enter in effort at the team member level but also have the sum of the effort show up in both tables. If you had to get this same functionality in a spreadsheet, you would have to do a combination of SUMIF and VLOOKUP.
Now that we’ve built out our 3 main tables, let’s get into the fun stuff of visualizing our data so we can see what features are being staffed by whom, which team members are being over-allocated, and where effort is being distributed among the team.

How to Set Achievable Timeframes

Let’s build a simple view of our “Features” table that hides a few columns so that it only shows the feature name, description, start date, and end date. When you create a , it’s like creating a copy of that table but all changes you make in the view also carry over into the table as well.
creating views of the product features table to customize how the data is laid out in Coda
While this view of the “Features” table looks alright, it would be a lot more useful if we could see a visual roadmap of how these features stack against each other. If we insert a , Coda automatically looks at your start and end dates to build out the Gantt chart:
view the product features on a Gantt chart or timeline chart to visualize your product features in a better format
You’ll notice that when you move the bars in the Gantt chart, it also changes the dates in the “Main Features” view. This is a core concept in Coda where all your product planning data — regardless if it’s in a table or chart — are connected.

How to Allocate Resources & Estimate Effort Invested in Product Planning

Now that you see how we can build views off of tables, let’s build a view off of the “Resource Allocation” table. With this view, we can group by the Feature column to quickly see the team members working on each feature in an organized way. If we change the number in the Effort column of our view, it changes it in the main “Resource Allocation” table as well.
grouping columns in Coda

Resource Utilization by Person

Nothing is worse than a team that is burnt out. Being able to visualize the workload for each team member can help you protect and balance your most important resource: your team’s energy. The chart below is a view of your “Resource Allocation” table but the layout is a stacked bar chart. You can quickly see who is being overloaded based on the total Effort that team member has:
stacked bar chart to see your team member's resource utilization in a better format
Perhaps you still want to see how your team is being resourced in a table format, so you can build a view for that. One of my favorite layouts is the gantt chart broken down by person, so now you see a timeline by person but you can drill down into the features that person is working on as well:
view the full schedule of how your team is being utilized by person in a timeline chart or gantt chart

Resource Utilization by Feature

Since we have our “Resource Allocation” main table built out, we can view our data in many ways. This is similar to how PivotTables work in Excel. In this view, we see a timeline/gantt chart broken out by features, but once we drill down we see the team members associated with that task. This is like the reverse of the Gantt chart you see in the previous gif:
see your resource utilization by feature in Coda

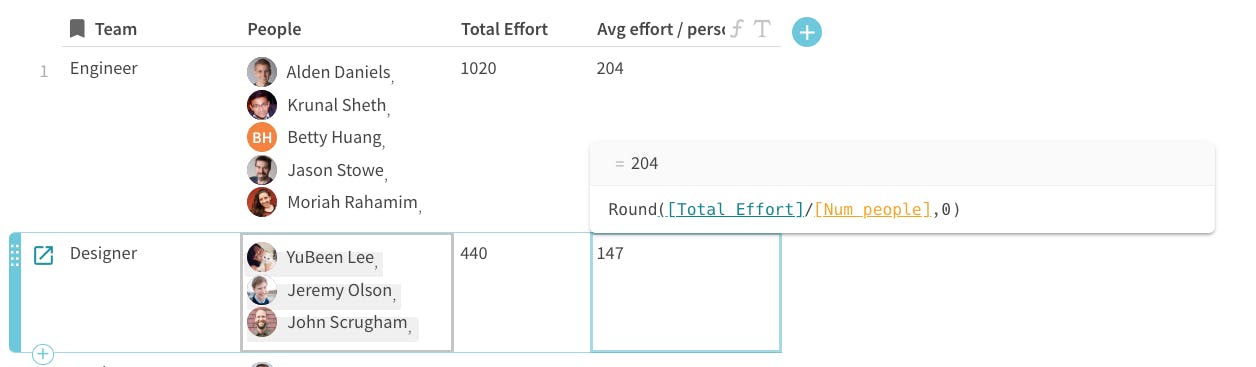
Resource Utilization by Team

Finally, a really useful view of our “Resource Allocation” table is grouping data by Teams. Since we have entered all the Effort for a team member and we have mapped team members to teams, we can get a bird’s eye view of the total estimated effort by Team:
see your resource utilization by team roles
If you recall our original “Team” table, it only had two columns: Team and People. There are actually a few columns hidden in that table, so the view below, we unhide the Total Effort and Avg effort / person columns to see the total hours or story points each team has:
see the average effort or resources required per person in Coda
The Avg effort / person is a formula that takes the Total Effort and divides it by the number of people in each team (represented by a hidden [Num People] column. Now we can see that the Engineering team is clearly the team that is adding the most effort to this product launch.
custom formula in a Coda table to find the average effort per team member

Final Thoughts

Creating a great product strategy and building your own product roadmap in Excel or Google Sheets can get complicated as your team grows and the features you need require extra customizations. On the flip side, if you buy a specialized piece of software to manage product planning process or product roadmapping, you are constrained to that software’s own feature set. A flexible gives you freedom to shape the roadmap to your team’s processes.
There are many different techniques for managing a , and sometimes the most important part is focusing more on the product planning process rather than the final product. By building your own application that looks and feels like a real product roadmap software (without needing to be a programmer), you can get the best of both worlds.
Find freedom on the canvas. — Bob Ross

Product Planning FAQs

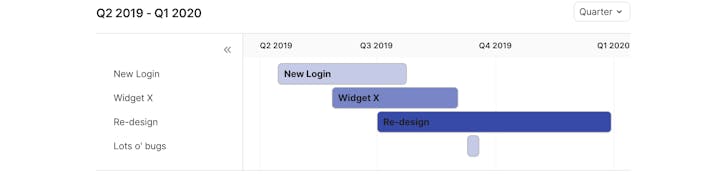
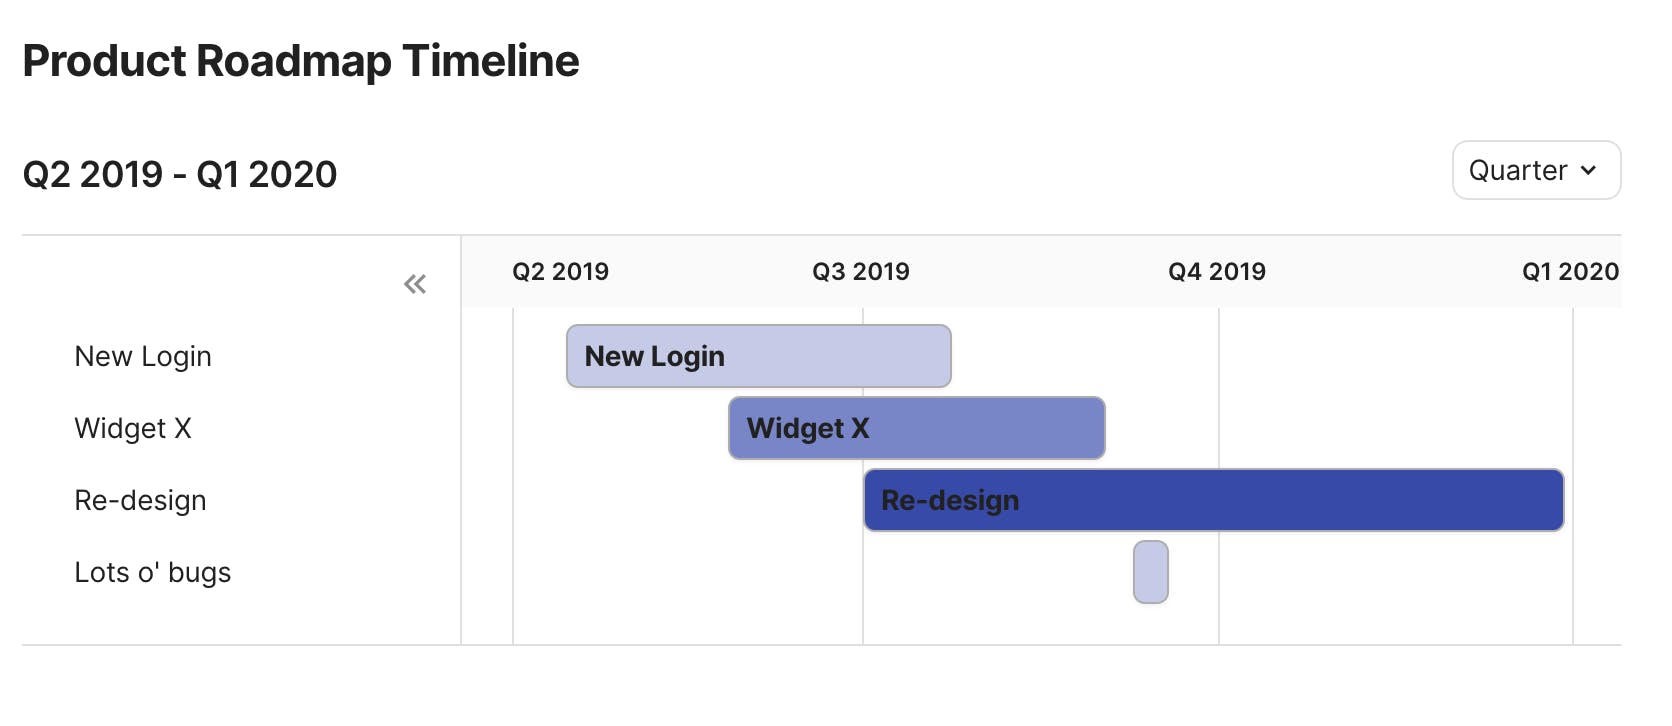
What is a product roadmap?

A product roadmap is a document that outlines the big picture vision for a product, and is used to track product development step by step, allocate resources, and identify blockers in real-time. Done correctly, a product roadmap helps teams have better alignment to achieve business goals together.

What is the best product planning software?

The best product planning software is one that is designed and built by your team, for your team. At Coda, product planning is a process that changes with the needs and demands of your team instead of just a tool.

Who is responsible for the product roadmap?

Product managers should own the product roadmap and the product planning process. Yes, this is a distinct role on the team. PMs are key team players who work with all project stakeholders to protect resources, determine prioritization, manage expectations, and balance priorities in order to ship deliverables on time and in line with the product market demands.

A few of the 40,000+ teams that 🏃‍♀️ on Coda.

image.png
Coda is an all-in-one doc for your team’s unique processes — the rituals that help you succeed. Teams that use Coda get rid of hundreds of documents, spreadsheets, and even bespoke apps, to work quickly and clearly in one place. This template is a Coda doc. Click around to explore.
Find out how to Coda-fy your rituals.

Want to print your doc?
This is not the way.
Try clicking the ⋯ next to your doc name or using a keyboard shortcut (
CtrlP
) instead.